Iroquois vs Immigrants from Vietnam Male Poverty
COMPARE
Iroquois
Immigrants from Vietnam
Male Poverty
Male Poverty Comparison
Iroquois
Immigrants from Vietnam
13.2%
MALE POVERTY
0.1/ 100
METRIC RATING
264th/ 347
METRIC RANK
10.8%
MALE POVERTY
83.0/ 100
METRIC RATING
132nd/ 347
METRIC RANK
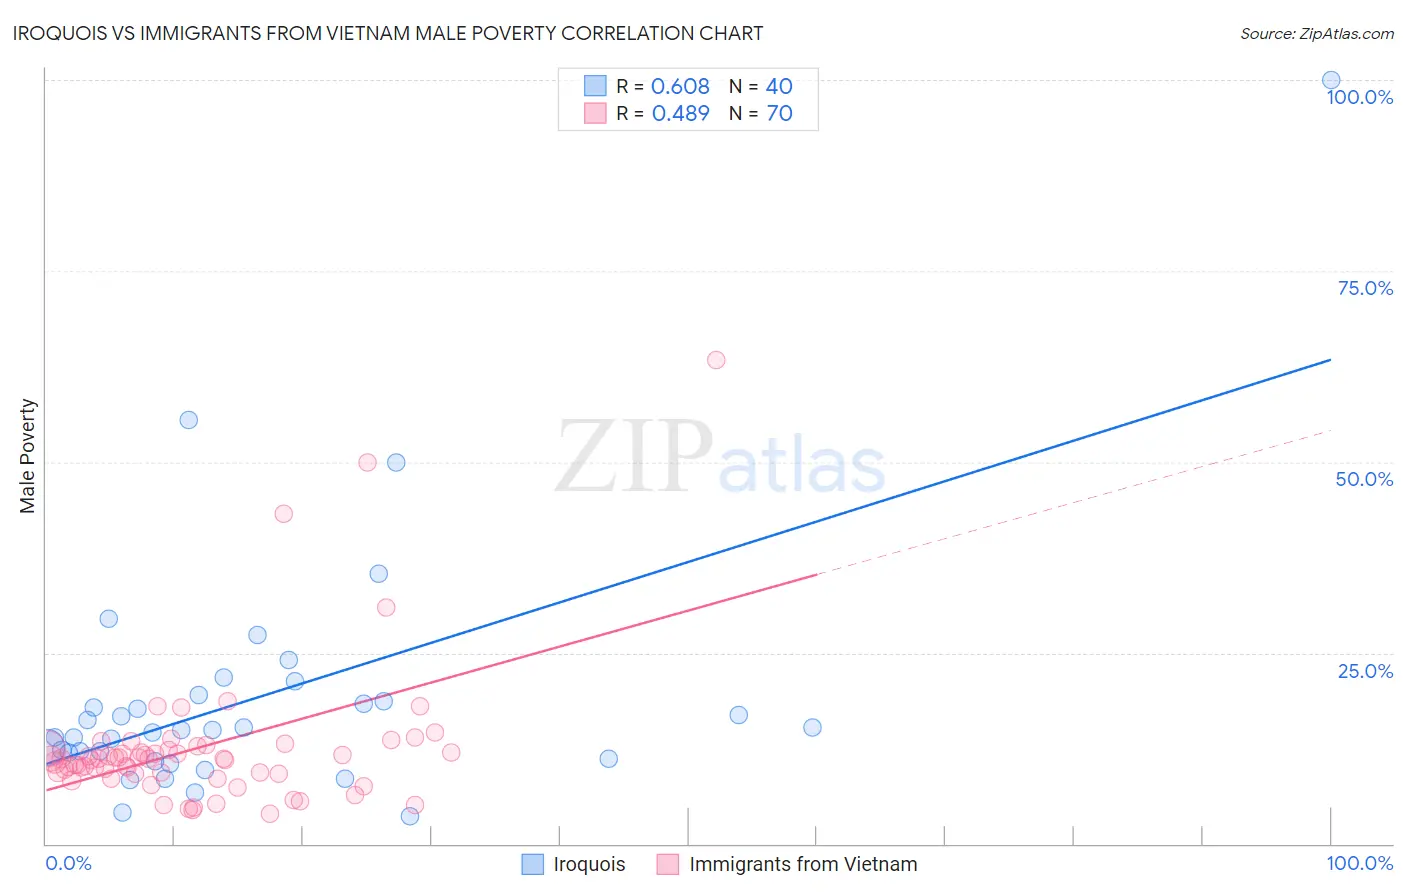
Iroquois vs Immigrants from Vietnam Male Poverty Correlation Chart
The statistical analysis conducted on geographies consisting of 207,214,183 people shows a significant positive correlation between the proportion of Iroquois and poverty level among males in the United States with a correlation coefficient (R) of 0.608 and weighted average of 13.2%. Similarly, the statistical analysis conducted on geographies consisting of 404,476,385 people shows a moderate positive correlation between the proportion of Immigrants from Vietnam and poverty level among males in the United States with a correlation coefficient (R) of 0.489 and weighted average of 10.8%, a difference of 22.9%.
Male Poverty Correlation Summary
| Measurement | Iroquois | Immigrants from Vietnam |
| Minimum | 3.6% | 4.0% |
| Maximum | 100.0% | 63.3% |
| Range | 96.4% | 59.4% |
| Mean | 19.1% | 12.6% |
| Median | 14.9% | 11.1% |
| Interquartile 25% (IQ1) | 11.5% | 9.2% |
| Interquartile 75% (IQ3) | 19.1% | 12.4% |
| Interquartile Range (IQR) | 7.5% | 3.2% |
| Standard Deviation (Sample) | 16.8% | 9.5% |
| Standard Deviation (Population) | 16.6% | 9.4% |
Similar Demographics by Male Poverty
Demographics Similar to Iroquois by Male Poverty
In terms of male poverty, the demographic groups most similar to Iroquois are Jamaican (13.2%, a difference of 0.020%), Immigrants from Guyana (13.2%, a difference of 0.16%), Immigrants from Jamaica (13.3%, a difference of 0.28%), Subsaharan African (13.3%, a difference of 0.30%), and Central American (13.2%, a difference of 0.36%).
| Demographics | Rating | Rank | Male Poverty |
| Immigrants | Trinidad and Tobago | 0.1 /100 | #257 | Tragic 13.1% |
| Cape Verdeans | 0.1 /100 | #258 | Tragic 13.1% |
| Cherokee | 0.1 /100 | #259 | Tragic 13.1% |
| Ottawa | 0.1 /100 | #260 | Tragic 13.1% |
| Trinidadians and Tobagonians | 0.1 /100 | #261 | Tragic 13.1% |
| Spanish American Indians | 0.1 /100 | #262 | Tragic 13.1% |
| Central Americans | 0.1 /100 | #263 | Tragic 13.2% |
| Iroquois | 0.1 /100 | #264 | Tragic 13.2% |
| Jamaicans | 0.1 /100 | #265 | Tragic 13.2% |
| Immigrants | Guyana | 0.1 /100 | #266 | Tragic 13.2% |
| Immigrants | Jamaica | 0.1 /100 | #267 | Tragic 13.3% |
| Sub-Saharan Africans | 0.1 /100 | #268 | Tragic 13.3% |
| Guyanese | 0.0 /100 | #269 | Tragic 13.3% |
| Cree | 0.0 /100 | #270 | Tragic 13.3% |
| Spanish Americans | 0.0 /100 | #271 | Tragic 13.4% |
Demographics Similar to Immigrants from Vietnam by Male Poverty
In terms of male poverty, the demographic groups most similar to Immigrants from Vietnam are Pakistani (10.8%, a difference of 0.010%), New Zealander (10.8%, a difference of 0.020%), Immigrants from Belarus (10.7%, a difference of 0.050%), Brazilian (10.8%, a difference of 0.060%), and Chilean (10.7%, a difference of 0.16%).
| Demographics | Rating | Rank | Male Poverty |
| Immigrants | Norway | 86.0 /100 | #125 | Excellent 10.7% |
| Immigrants | Ukraine | 84.3 /100 | #126 | Excellent 10.7% |
| Puget Sound Salish | 84.3 /100 | #127 | Excellent 10.7% |
| Immigrants | Western Europe | 84.2 /100 | #128 | Excellent 10.7% |
| Immigrants | Peru | 84.1 /100 | #129 | Excellent 10.7% |
| Chileans | 83.9 /100 | #130 | Excellent 10.7% |
| Immigrants | Belarus | 83.3 /100 | #131 | Excellent 10.7% |
| Immigrants | Vietnam | 83.0 /100 | #132 | Excellent 10.8% |
| Pakistanis | 83.0 /100 | #133 | Excellent 10.8% |
| New Zealanders | 82.9 /100 | #134 | Excellent 10.8% |
| Brazilians | 82.7 /100 | #135 | Excellent 10.8% |
| Immigrants | Israel | 80.9 /100 | #136 | Excellent 10.8% |
| Immigrants | Switzerland | 79.2 /100 | #137 | Good 10.8% |
| Yugoslavians | 78.2 /100 | #138 | Good 10.8% |
| Immigrants | Jordan | 77.5 /100 | #139 | Good 10.8% |