Iroquois vs Costa Rican Male Poverty
COMPARE
Iroquois
Costa Rican
Male Poverty
Male Poverty Comparison
Iroquois
Costa Ricans
13.2%
MALE POVERTY
0.1/ 100
METRIC RATING
264th/ 347
METRIC RANK
11.0%
MALE POVERTY
63.9/ 100
METRIC RATING
156th/ 347
METRIC RANK
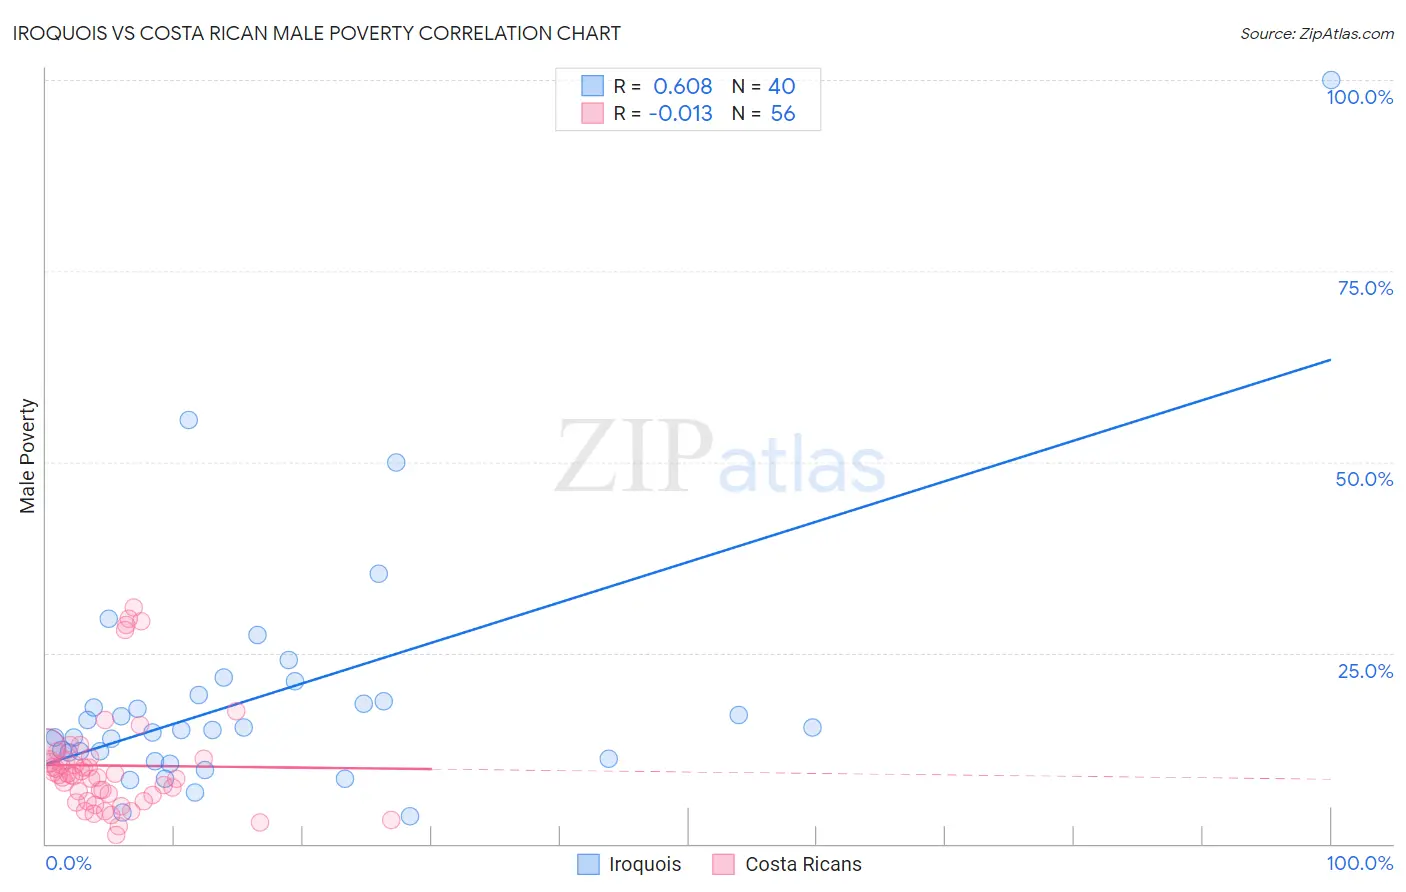
Iroquois vs Costa Rican Male Poverty Correlation Chart
The statistical analysis conducted on geographies consisting of 207,214,183 people shows a significant positive correlation between the proportion of Iroquois and poverty level among males in the United States with a correlation coefficient (R) of 0.608 and weighted average of 13.2%. Similarly, the statistical analysis conducted on geographies consisting of 253,451,633 people shows no correlation between the proportion of Costa Ricans and poverty level among males in the United States with a correlation coefficient (R) of -0.013 and weighted average of 11.0%, a difference of 19.8%.
Male Poverty Correlation Summary
| Measurement | Iroquois | Costa Rican |
| Minimum | 3.6% | 1.1% |
| Maximum | 100.0% | 31.0% |
| Range | 96.4% | 29.8% |
| Mean | 19.1% | 10.2% |
| Median | 14.9% | 9.0% |
| Interquartile 25% (IQ1) | 11.5% | 6.0% |
| Interquartile 75% (IQ3) | 19.1% | 11.0% |
| Interquartile Range (IQR) | 7.5% | 5.0% |
| Standard Deviation (Sample) | 16.8% | 6.9% |
| Standard Deviation (Population) | 16.6% | 6.8% |
Similar Demographics by Male Poverty
Demographics Similar to Iroquois by Male Poverty
In terms of male poverty, the demographic groups most similar to Iroquois are Jamaican (13.2%, a difference of 0.020%), Immigrants from Guyana (13.2%, a difference of 0.16%), Immigrants from Jamaica (13.3%, a difference of 0.28%), Subsaharan African (13.3%, a difference of 0.30%), and Central American (13.2%, a difference of 0.36%).
| Demographics | Rating | Rank | Male Poverty |
| Immigrants | Trinidad and Tobago | 0.1 /100 | #257 | Tragic 13.1% |
| Cape Verdeans | 0.1 /100 | #258 | Tragic 13.1% |
| Cherokee | 0.1 /100 | #259 | Tragic 13.1% |
| Ottawa | 0.1 /100 | #260 | Tragic 13.1% |
| Trinidadians and Tobagonians | 0.1 /100 | #261 | Tragic 13.1% |
| Spanish American Indians | 0.1 /100 | #262 | Tragic 13.1% |
| Central Americans | 0.1 /100 | #263 | Tragic 13.2% |
| Iroquois | 0.1 /100 | #264 | Tragic 13.2% |
| Jamaicans | 0.1 /100 | #265 | Tragic 13.2% |
| Immigrants | Guyana | 0.1 /100 | #266 | Tragic 13.2% |
| Immigrants | Jamaica | 0.1 /100 | #267 | Tragic 13.3% |
| Sub-Saharan Africans | 0.1 /100 | #268 | Tragic 13.3% |
| Guyanese | 0.0 /100 | #269 | Tragic 13.3% |
| Cree | 0.0 /100 | #270 | Tragic 13.3% |
| Spanish Americans | 0.0 /100 | #271 | Tragic 13.4% |
Demographics Similar to Costa Ricans by Male Poverty
In terms of male poverty, the demographic groups most similar to Costa Ricans are Scotch-Irish (11.0%, a difference of 0.020%), Immigrants from Malaysia (11.0%, a difference of 0.090%), Immigrants from Kazakhstan (11.0%, a difference of 0.10%), Colombian (11.0%, a difference of 0.10%), and Taiwanese (11.0%, a difference of 0.12%).
| Demographics | Rating | Rank | Male Poverty |
| Immigrants | Venezuela | 67.9 /100 | #149 | Good 11.0% |
| Guamanians/Chamorros | 67.6 /100 | #150 | Good 11.0% |
| Venezuelans | 67.4 /100 | #151 | Good 11.0% |
| Immigrants | Nepal | 67.3 /100 | #152 | Good 11.0% |
| Immigrants | Bosnia and Herzegovina | 65.2 /100 | #153 | Good 11.0% |
| Immigrants | Kazakhstan | 64.8 /100 | #154 | Good 11.0% |
| Immigrants | Malaysia | 64.7 /100 | #155 | Good 11.0% |
| Costa Ricans | 63.9 /100 | #156 | Good 11.0% |
| Scotch-Irish | 63.7 /100 | #157 | Good 11.0% |
| Colombians | 63.0 /100 | #158 | Good 11.0% |
| Taiwanese | 62.7 /100 | #159 | Good 11.0% |
| Soviet Union | 60.3 /100 | #160 | Good 11.1% |
| Immigrants | Northern Africa | 59.7 /100 | #161 | Average 11.1% |
| Immigrants | Chile | 57.4 /100 | #162 | Average 11.1% |
| Whites/Caucasians | 56.7 /100 | #163 | Average 11.1% |