Iroquois vs West Indian Male Poverty
COMPARE
Iroquois
West Indian
Male Poverty
Male Poverty Comparison
Iroquois
West Indians
13.2%
MALE POVERTY
0.1/ 100
METRIC RATING
264th/ 347
METRIC RANK
13.8%
MALE POVERTY
0.0/ 100
METRIC RATING
285th/ 347
METRIC RANK
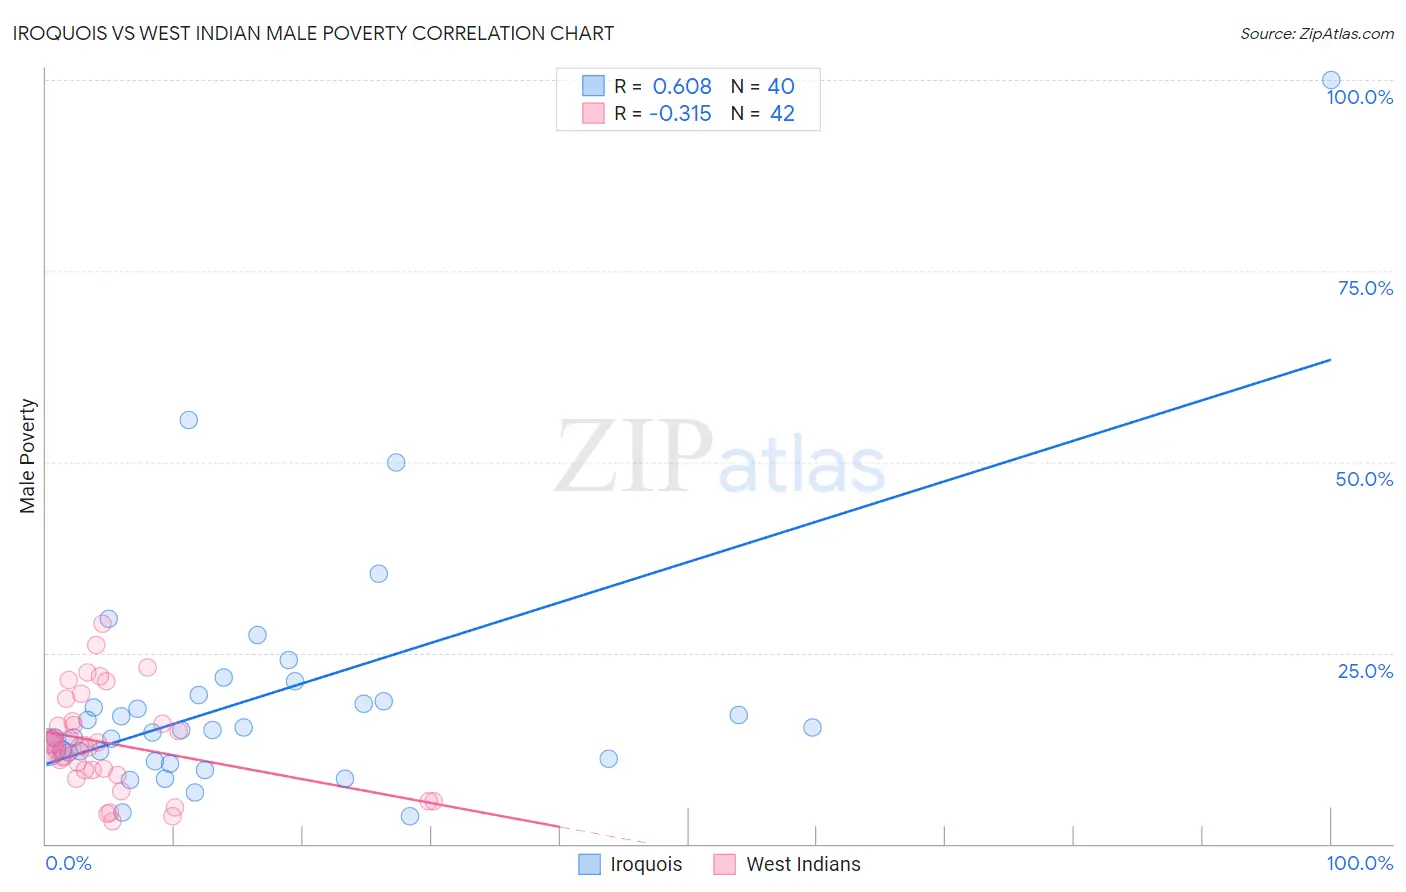
Iroquois vs West Indian Male Poverty Correlation Chart
The statistical analysis conducted on geographies consisting of 207,214,183 people shows a significant positive correlation between the proportion of Iroquois and poverty level among males in the United States with a correlation coefficient (R) of 0.608 and weighted average of 13.2%. Similarly, the statistical analysis conducted on geographies consisting of 253,851,843 people shows a mild negative correlation between the proportion of West Indians and poverty level among males in the United States with a correlation coefficient (R) of -0.315 and weighted average of 13.8%, a difference of 4.1%.
Male Poverty Correlation Summary
| Measurement | Iroquois | West Indian |
| Minimum | 3.6% | 3.0% |
| Maximum | 100.0% | 28.8% |
| Range | 96.4% | 25.8% |
| Mean | 19.1% | 13.2% |
| Median | 14.9% | 12.9% |
| Interquartile 25% (IQ1) | 11.5% | 9.6% |
| Interquartile 75% (IQ3) | 19.1% | 15.8% |
| Interquartile Range (IQR) | 7.5% | 6.2% |
| Standard Deviation (Sample) | 16.8% | 6.2% |
| Standard Deviation (Population) | 16.6% | 6.2% |
Similar Demographics by Male Poverty
Demographics Similar to Iroquois by Male Poverty
In terms of male poverty, the demographic groups most similar to Iroquois are Jamaican (13.2%, a difference of 0.020%), Immigrants from Guyana (13.2%, a difference of 0.16%), Immigrants from Jamaica (13.3%, a difference of 0.28%), Subsaharan African (13.3%, a difference of 0.30%), and Central American (13.2%, a difference of 0.36%).
| Demographics | Rating | Rank | Male Poverty |
| Immigrants | Trinidad and Tobago | 0.1 /100 | #257 | Tragic 13.1% |
| Cape Verdeans | 0.1 /100 | #258 | Tragic 13.1% |
| Cherokee | 0.1 /100 | #259 | Tragic 13.1% |
| Ottawa | 0.1 /100 | #260 | Tragic 13.1% |
| Trinidadians and Tobagonians | 0.1 /100 | #261 | Tragic 13.1% |
| Spanish American Indians | 0.1 /100 | #262 | Tragic 13.1% |
| Central Americans | 0.1 /100 | #263 | Tragic 13.2% |
| Iroquois | 0.1 /100 | #264 | Tragic 13.2% |
| Jamaicans | 0.1 /100 | #265 | Tragic 13.2% |
| Immigrants | Guyana | 0.1 /100 | #266 | Tragic 13.2% |
| Immigrants | Jamaica | 0.1 /100 | #267 | Tragic 13.3% |
| Sub-Saharan Africans | 0.1 /100 | #268 | Tragic 13.3% |
| Guyanese | 0.0 /100 | #269 | Tragic 13.3% |
| Cree | 0.0 /100 | #270 | Tragic 13.3% |
| Spanish Americans | 0.0 /100 | #271 | Tragic 13.4% |
Demographics Similar to West Indians by Male Poverty
In terms of male poverty, the demographic groups most similar to West Indians are Immigrants from Haiti (13.8%, a difference of 0.010%), Comanche (13.8%, a difference of 0.020%), Shoshone (13.8%, a difference of 0.030%), Immigrants from Barbados (13.8%, a difference of 0.050%), and Immigrants from St. Vincent and the Grenadines (13.8%, a difference of 0.22%).
| Demographics | Rating | Rank | Male Poverty |
| Belizeans | 0.0 /100 | #278 | Tragic 13.6% |
| Haitians | 0.0 /100 | #279 | Tragic 13.7% |
| Mexicans | 0.0 /100 | #280 | Tragic 13.7% |
| Yaqui | 0.0 /100 | #281 | Tragic 13.7% |
| Immigrants | Cabo Verde | 0.0 /100 | #282 | Tragic 13.7% |
| Comanche | 0.0 /100 | #283 | Tragic 13.8% |
| Immigrants | Haiti | 0.0 /100 | #284 | Tragic 13.8% |
| West Indians | 0.0 /100 | #285 | Tragic 13.8% |
| Shoshone | 0.0 /100 | #286 | Tragic 13.8% |
| Immigrants | Barbados | 0.0 /100 | #287 | Tragic 13.8% |
| Immigrants | St. Vincent and the Grenadines | 0.0 /100 | #288 | Tragic 13.8% |
| Guatemalans | 0.0 /100 | #289 | Tragic 13.8% |
| Immigrants | Zaire | 0.0 /100 | #290 | Tragic 13.8% |
| Vietnamese | 0.0 /100 | #291 | Tragic 13.8% |
| Indonesians | 0.0 /100 | #292 | Tragic 13.8% |