Immigrants from Haiti vs Immigrants from Vietnam Male Poverty

COMPARE

Immigrants from Haiti
Race
Ancestry
AfghanAfricanAlaska NativeAlaskan AthabascanAlbanianAleutAlsatianAmericanApacheArabArapahoArgentineanArmenianAssyrian/Chaldean/SyriacAustralianAustrianBahamianBangladeshiBarbadianBasqueBelgianBelizeanBermudanBhutaneseBlackfeetBolivianBrazilianBritishBritish West IndianBulgarianBurmeseCajunCambodianCanadianCape VerdeanCarpatho RusynCelticCentral AmericanCentral American IndianCherokeeCheyenneChickasawChileanChineseChippewaChoctawColombianColvilleComancheCosta RicanCreeCreekCroatianCrowCubanCypriotCzechCzechoslovakianDanishDelawareDominicanDutchDutch West IndianEastern EuropeanEcuadorianEgyptianEnglishEstonianEthiopianEuropeanFijianFilipinoFinnishFrenchFrench American IndianFrench CanadianGermanGerman RussianGhanaianGreekGuamanian/ChamorroGuatemalanGuyaneseHaitianHmongHonduranHopiHoumaHungarianIcelanderIndian (Asian)IndonesianInupiatIranianIraqiIrishIroquoisIsraeliItalianJamaicanJapaneseJordanianKenyanKiowaKoreanLaotianLatvianLebaneseLiberianLithuanianLumbeeLuxembourgerMacedonianMalaysianMalteseMarshalleseMenomineeMexicanMexican American IndianMongolianMoroccanNative HawaiianNavajoNepaleseNew ZealanderNicaraguanNigerianNorthern EuropeanNorwegianOkinawanOsageOttawaPaiutePakistaniPalestinianPanamanianParaguayanPennsylvania GermanPeruvianPimaPolishPortuguesePotawatomiPuebloPuerto RicanPuget Sound SalishRomanianRussianSalvadoranSamoanScandinavianScotch-IrishScottishSeminoleSenegaleseSerbianShoshoneSierra LeoneanSiouxSlavicSlovakSloveneSomaliSouth AfricanSouth AmericanSouth American IndianSoviet UnionSpaniardSpanishSpanish AmericanSpanish American IndianSri LankanSubsaharan AfricanSudaneseSwedishSwissSyrianTaiwaneseThaiTlingit-HaidaTohono O'OdhamTonganTrinidadian and TobagonianTsimshianTurkishU.S. Virgin IslanderUgandanUkrainianUruguayanUteVenezuelanVietnameseWelshWest IndianYakamaYaquiYugoslavianYumanYup'ikZimbabwean
Immigration
NonimmigrantsImmigrantsAfghanistanAfricaAlbaniaArgentinaArmeniaAsiaAustraliaAustriaBahamasBangladeshBarbadosBelarusBelgiumBelizeBoliviaBosnia and HerzegovinaBrazilBulgariaBurma/MyanmarCabo VerdeCambodiaCameroonCanadaCaribbeanCentral AmericaChileChinaColombiaCongoCosta RicaCroatiaCubaCzechoslovakiaDenmarkDominicaDominican RepublicEastern AfricaEastern AsiaEastern EuropeEcuadorEgyptEl SalvadorEnglandEritreaEthiopiaEuropeFijiFranceGermanyGhanaGreeceGrenadaGuatemalaGuyanaHaitiHondurasHong KongHungaryIndiaIndonesiaIranIraqIrelandIsraelItalyJamaicaJapanJordanKazakhstanKenyaKoreaKuwaitLaosLatin AmericaLatviaLebanonLiberiaLithuaniaMalaysiaMexicoMicronesiaMiddle AfricaMoldovaMoroccoNepalNetherlandsNicaraguaNigeriaNorth AmericaNorth MacedoniaNorthern AfricaNorthern EuropeNorwayOceaniaPakistanPanamaPeruPhilippinesPolandPortugalRomaniaRussiaSaudi ArabiaScotlandSenegalSerbiaSierra LeoneSingaporeSomaliaSouth AfricaSouth AmericaSouth Central AsiaSouth Eastern AsiaSouthern EuropeSpainSri LankaSt. Vincent and the GrenadinesSudanSwedenSwitzerlandSyriaTaiwanThailandTrinidad and TobagoTurkeyUgandaUkraineUruguayUzbekistanVenezuelaWest IndiesWestern AfricaWestern AsiaWestern EuropeYemenZaireZimbabweAzores
Immigrants from Vietnam
Race
Ancestry
AfghanAfricanAlaska NativeAlaskan AthabascanAlbanianAleutAlsatianAmericanApacheArabArapahoArgentineanArmenianAssyrian/Chaldean/SyriacAustralianAustrianBahamianBangladeshiBarbadianBasqueBelgianBelizeanBermudanBhutaneseBlackfeetBolivianBrazilianBritishBritish West IndianBulgarianBurmeseCajunCambodianCanadianCape VerdeanCarpatho RusynCelticCentral AmericanCentral American IndianCherokeeCheyenneChickasawChileanChineseChippewaChoctawColombianColvilleComancheCosta RicanCreeCreekCroatianCrowCubanCypriotCzechCzechoslovakianDanishDelawareDominicanDutchDutch West IndianEastern EuropeanEcuadorianEgyptianEnglishEstonianEthiopianEuropeanFijianFilipinoFinnishFrenchFrench American IndianFrench CanadianGermanGerman RussianGhanaianGreekGuamanian/ChamorroGuatemalanGuyaneseHaitianHmongHonduranHopiHoumaHungarianIcelanderIndian (Asian)IndonesianInupiatIranianIraqiIrishIroquoisIsraeliItalianJamaicanJapaneseJordanianKenyanKiowaKoreanLaotianLatvianLebaneseLiberianLithuanianLumbeeLuxembourgerMacedonianMalaysianMalteseMarshalleseMenomineeMexicanMexican American IndianMongolianMoroccanNative HawaiianNavajoNepaleseNew ZealanderNicaraguanNigerianNorthern EuropeanNorwegianOkinawanOsageOttawaPaiutePakistaniPalestinianPanamanianParaguayanPennsylvania GermanPeruvianPimaPolishPortuguesePotawatomiPuebloPuerto RicanPuget Sound SalishRomanianRussianSalvadoranSamoanScandinavianScotch-IrishScottishSeminoleSenegaleseSerbianShoshoneSierra LeoneanSiouxSlavicSlovakSloveneSomaliSouth AfricanSouth AmericanSouth American IndianSoviet UnionSpaniardSpanishSpanish AmericanSpanish American IndianSri LankanSubsaharan AfricanSudaneseSwedishSwissSyrianTaiwaneseThaiTlingit-HaidaTohono O'OdhamTonganTrinidadian and TobagonianTsimshianTurkishU.S. Virgin IslanderUgandanUkrainianUruguayanUteVenezuelanVietnameseWelshWest IndianYakamaYaquiYugoslavianYumanYup'ikZimbabwean
Immigration
NonimmigrantsImmigrantsAfghanistanAfricaAlbaniaArgentinaArmeniaAsiaAustraliaAustriaBahamasBangladeshBarbadosBelarusBelgiumBelizeBoliviaBosnia and HerzegovinaBrazilBulgariaBurma/MyanmarCabo VerdeCambodiaCameroonCanadaCaribbeanCentral AmericaChileChinaColombiaCongoCosta RicaCroatiaCubaCzechoslovakiaDenmarkDominicaDominican RepublicEastern AfricaEastern AsiaEastern EuropeEcuadorEgyptEl SalvadorEnglandEritreaEthiopiaEuropeFijiFranceGermanyGhanaGreeceGrenadaGuatemalaGuyanaHondurasHong KongHungaryIndiaIndonesiaIranIraqIrelandIsraelItalyJamaicaJapanJordanKazakhstanKenyaKoreaKuwaitLaosLatin AmericaLatviaLebanonLiberiaLithuaniaMalaysiaMexicoMicronesiaMiddle AfricaMoldovaMoroccoNepalNetherlandsNicaraguaNigeriaNorth AmericaNorth MacedoniaNorthern AfricaNorthern EuropeNorwayOceaniaPakistanPanamaPeruPhilippinesPolandPortugalRomaniaRussiaSaudi ArabiaScotlandSenegalSerbiaSierra LeoneSingaporeSomaliaSouth AfricaSouth AmericaSouth Central AsiaSouth Eastern AsiaSouthern EuropeSpainSri LankaSt. Vincent and the GrenadinesSudanSwedenSwitzerlandSyriaTaiwanThailandTrinidad and TobagoTurkeyUgandaUkraineUruguayUzbekistanVenezuelaVietnamWest IndiesWestern AfricaWestern AsiaWestern EuropeYemenZaireZimbabweAzores
Male Poverty
Income
Poverty
Unemployment
Labor Participation
Family Structure
Vehicle Availability
Education Level
Disability

Male Poverty Comparison

Immigrants from Haiti

Immigrants from Vietnam

Tragic
Excellent
13.8%
MALE POVERTY
0.0/ 100
METRIC RATING
284th/ 347
METRIC RANK
10.8%
MALE POVERTY
83.0/ 100
METRIC RATING
132nd/ 347
METRIC RANK

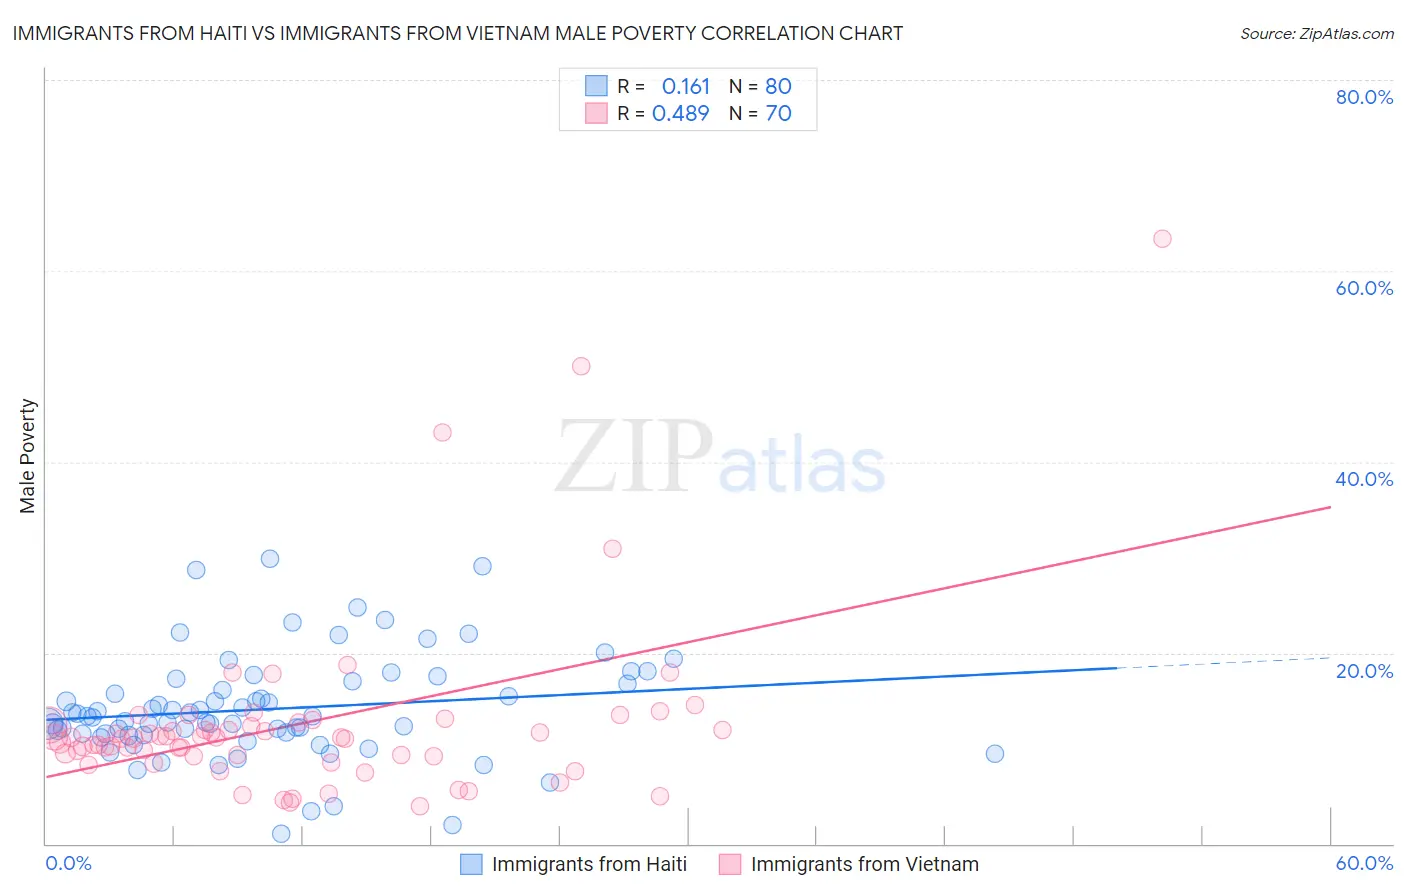
Immigrants from Haiti vs Immigrants from Vietnam Male Poverty Correlation Chart

The statistical analysis conducted on geographies consisting of 225,134,025 people shows a poor positive correlation between the proportion of Immigrants from Haiti and poverty level among males in the United States with a correlation coefficient (R) of 0.161 and weighted average of 13.8%. Similarly, the statistical analysis conducted on geographies consisting of 404,476,385 people shows a moderate positive correlation between the proportion of Immigrants from Vietnam and poverty level among males in the United States with a correlation coefficient (R) of 0.489 and weighted average of 10.8%, a difference of 27.9%.
Immigrants from Haiti vs Immigrants from Vietnam Male Poverty

Male Poverty Correlation Summary

MeasurementImmigrants from HaitiImmigrants from Vietnam
Minimum0.99%4.0%
Maximum29.8%63.3%
Range28.8%59.4%
Mean14.1%12.6%
Median13.3%11.1%
Interquartile 25% (IQ1)11.5%9.2%
Interquartile 75% (IQ3)16.9%12.4%
Interquartile Range (IQR)5.4%3.2%
Standard Deviation (Sample)5.5%9.5%
Standard Deviation (Population)5.5%9.4%

Similar Demographics by Male Poverty

Demographics Similar to Immigrants from Haiti by Male Poverty

In terms of male poverty, the demographic groups most similar to Immigrants from Haiti are Comanche (13.8%, a difference of 0.010%), West Indian (13.8%, a difference of 0.010%), Shoshone (13.8%, a difference of 0.040%), Immigrants from Barbados (13.8%, a difference of 0.060%), and Immigrants from Cabo Verde (13.7%, a difference of 0.21%).
DemographicsRating | RankMale Poverty
Bangladeshis
0.0
/100
|
#277
Tragic
13.6%
Belizeans
0.0
/100
|
#278
Tragic
13.6%
Haitians
0.0
/100
|
#279
Tragic
13.7%
Mexicans
0.0
/100
|
#280
Tragic
13.7%
Yaqui
0.0
/100
|
#281
Tragic
13.7%
Immigrants | Cabo Verde
0.0
/100
|
#282
Tragic
13.7%
Comanche
0.0
/100
|
#283
Tragic
13.8%
Immigrants | Haiti
0.0
/100
|
#284
Tragic
13.8%
West Indians
0.0
/100
|
#285
Tragic
13.8%
Shoshone
0.0
/100
|
#286
Tragic
13.8%
Immigrants | Barbados
0.0
/100
|
#287
Tragic
13.8%
Immigrants | St. Vincent and the Grenadines
0.0
/100
|
#288
Tragic
13.8%
Guatemalans
0.0
/100
|
#289
Tragic
13.8%
Immigrants | Zaire
0.0
/100
|
#290
Tragic
13.8%
Vietnamese
0.0
/100
|
#291
Tragic
13.8%

Demographics Similar to Immigrants from Vietnam by Male Poverty

In terms of male poverty, the demographic groups most similar to Immigrants from Vietnam are Pakistani (10.8%, a difference of 0.010%), New Zealander (10.8%, a difference of 0.020%), Immigrants from Belarus (10.7%, a difference of 0.050%), Brazilian (10.8%, a difference of 0.060%), and Chilean (10.7%, a difference of 0.16%).
DemographicsRating | RankMale Poverty
Immigrants | Norway
86.0
/100
|
#125
Excellent
10.7%
Immigrants | Ukraine
84.3
/100
|
#126
Excellent
10.7%
Puget Sound Salish
84.3
/100
|
#127
Excellent
10.7%
Immigrants | Western Europe
84.2
/100
|
#128
Excellent
10.7%
Immigrants | Peru
84.1
/100
|
#129
Excellent
10.7%
Chileans
83.9
/100
|
#130
Excellent
10.7%
Immigrants | Belarus
83.3
/100
|
#131
Excellent
10.7%
Immigrants | Vietnam
83.0
/100
|
#132
Excellent
10.8%
Pakistanis
83.0
/100
|
#133
Excellent
10.8%
New Zealanders
82.9
/100
|
#134
Excellent
10.8%
Brazilians
82.7
/100
|
#135
Excellent
10.8%
Immigrants | Israel
80.9
/100
|
#136
Excellent
10.8%
Immigrants | Switzerland
79.2
/100
|
#137
Good
10.8%
Yugoslavians
78.2
/100
|
#138
Good
10.8%
Immigrants | Jordan
77.5
/100
|
#139
Good
10.8%