Iroquois vs Immigrants from Vietnam Female Poverty Among 18-24 Year Olds
COMPARE
Iroquois
Immigrants from Vietnam
Female Poverty Among 18-24 Year Olds
Female Poverty Among 18-24 Year Olds Comparison
Iroquois
Immigrants from Vietnam
22.9%
FEMALE POVERTY AMONG 18-24 YEAR OLDS
0.0/ 100
METRIC RATING
302nd/ 347
METRIC RANK
17.8%
FEMALE POVERTY AMONG 18-24 YEAR OLDS
100.0/ 100
METRIC RATING
31st/ 347
METRIC RANK
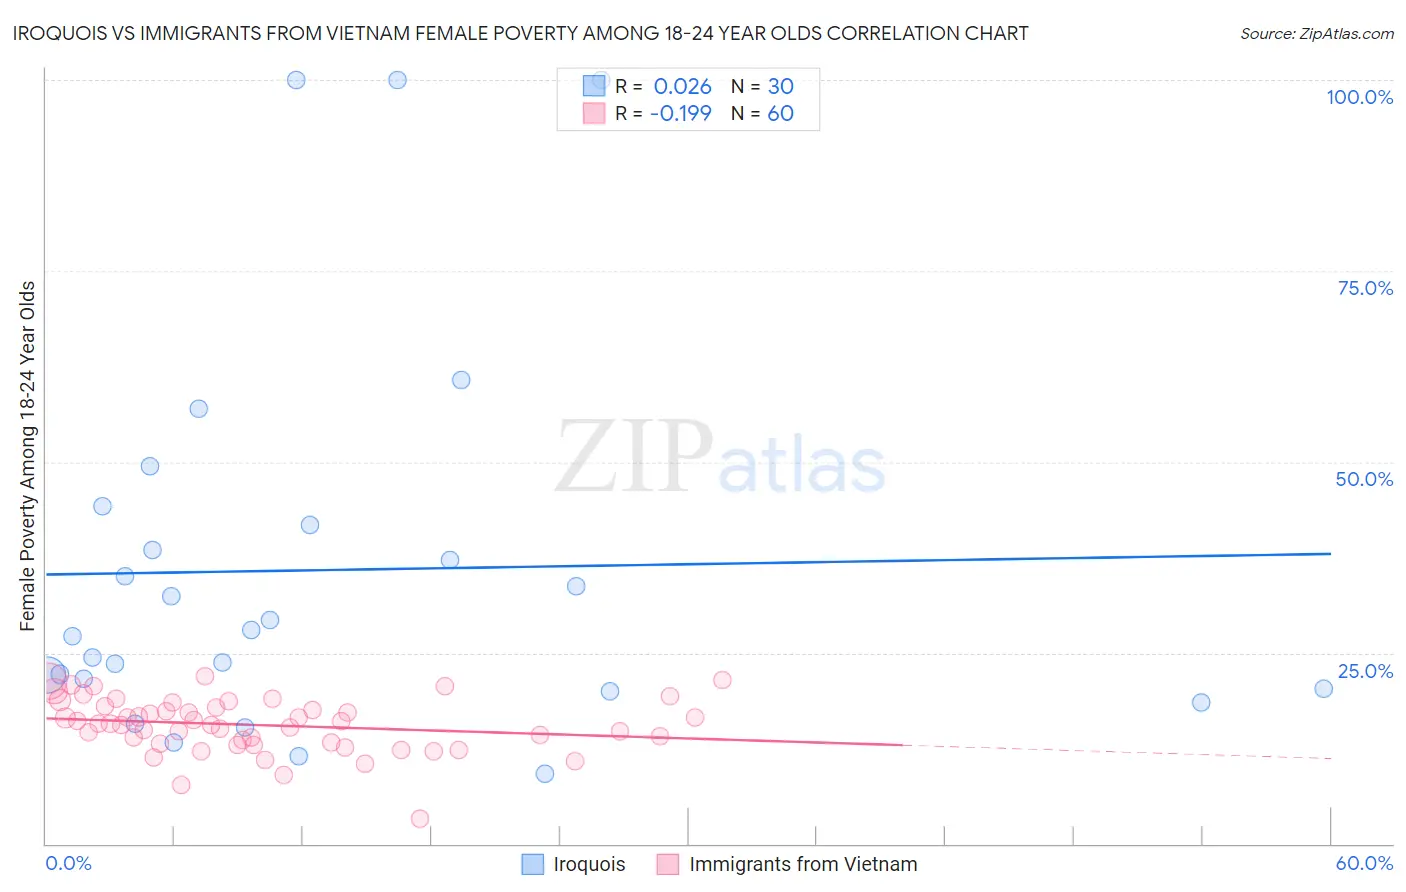
Iroquois vs Immigrants from Vietnam Female Poverty Among 18-24 Year Olds Correlation Chart
The statistical analysis conducted on geographies consisting of 204,291,578 people shows no correlation between the proportion of Iroquois and poverty level among females between the ages 18 and 24 in the United States with a correlation coefficient (R) of 0.026 and weighted average of 22.9%. Similarly, the statistical analysis conducted on geographies consisting of 396,080,445 people shows a poor negative correlation between the proportion of Immigrants from Vietnam and poverty level among females between the ages 18 and 24 in the United States with a correlation coefficient (R) of -0.199 and weighted average of 17.8%, a difference of 28.8%.
Female Poverty Among 18-24 Year Olds Correlation Summary
| Measurement | Iroquois | Immigrants from Vietnam |
| Minimum | 9.2% | 3.3% |
| Maximum | 100.0% | 22.0% |
| Range | 90.8% | 18.6% |
| Mean | 35.8% | 15.5% |
| Median | 27.6% | 15.7% |
| Interquartile 25% (IQ1) | 20.3% | 13.2% |
| Interquartile 75% (IQ3) | 41.7% | 17.9% |
| Interquartile Range (IQR) | 21.4% | 4.7% |
| Standard Deviation (Sample) | 25.2% | 3.6% |
| Standard Deviation (Population) | 24.7% | 3.6% |
Similar Demographics by Female Poverty Among 18-24 Year Olds
Demographics Similar to Iroquois by Female Poverty Among 18-24 Year Olds
In terms of female poverty among 18-24 year olds, the demographic groups most similar to Iroquois are Senegalese (23.0%, a difference of 0.15%), Sudanese (23.0%, a difference of 0.30%), Immigrants from Kuwait (23.0%, a difference of 0.35%), Seminole (22.9%, a difference of 0.39%), and African (22.8%, a difference of 0.48%).
| Demographics | Rating | Rank | Female Poverty Among 18-24 Year Olds |
| Shoshone | 0.0 /100 | #295 | Tragic 22.5% |
| Menominee | 0.0 /100 | #296 | Tragic 22.5% |
| Inupiat | 0.0 /100 | #297 | Tragic 22.6% |
| Central American Indians | 0.0 /100 | #298 | Tragic 22.6% |
| Cherokee | 0.0 /100 | #299 | Tragic 22.7% |
| Africans | 0.0 /100 | #300 | Tragic 22.8% |
| Seminole | 0.0 /100 | #301 | Tragic 22.9% |
| Iroquois | 0.0 /100 | #302 | Tragic 22.9% |
| Senegalese | 0.0 /100 | #303 | Tragic 23.0% |
| Sudanese | 0.0 /100 | #304 | Tragic 23.0% |
| Immigrants | Kuwait | 0.0 /100 | #305 | Tragic 23.0% |
| Paiute | 0.0 /100 | #306 | Tragic 23.3% |
| Cree | 0.0 /100 | #307 | Tragic 23.4% |
| Immigrants | Sudan | 0.0 /100 | #308 | Tragic 23.5% |
| Blackfeet | 0.0 /100 | #309 | Tragic 23.6% |
Demographics Similar to Immigrants from Vietnam by Female Poverty Among 18-24 Year Olds
In terms of female poverty among 18-24 year olds, the demographic groups most similar to Immigrants from Vietnam are Immigrants from South Eastern Asia (17.8%, a difference of 0.18%), Immigrants from Moldova (17.9%, a difference of 0.25%), Native Hawaiian (17.9%, a difference of 0.28%), Portuguese (17.8%, a difference of 0.36%), and Immigrants from Nicaragua (17.9%, a difference of 0.39%).
| Demographics | Rating | Rank | Female Poverty Among 18-24 Year Olds |
| Maltese | 100.0 /100 | #24 | Exceptional 17.6% |
| Immigrants | South Central Asia | 100.0 /100 | #25 | Exceptional 17.6% |
| Immigrants | Fiji | 100.0 /100 | #26 | Exceptional 17.7% |
| Colombians | 100.0 /100 | #27 | Exceptional 17.7% |
| Venezuelans | 100.0 /100 | #28 | Exceptional 17.7% |
| Portuguese | 100.0 /100 | #29 | Exceptional 17.8% |
| Immigrants | South Eastern Asia | 100.0 /100 | #30 | Exceptional 17.8% |
| Immigrants | Vietnam | 100.0 /100 | #31 | Exceptional 17.8% |
| Immigrants | Moldova | 100.0 /100 | #32 | Exceptional 17.9% |
| Native Hawaiians | 100.0 /100 | #33 | Exceptional 17.9% |
| Immigrants | Nicaragua | 100.0 /100 | #34 | Exceptional 17.9% |
| Immigrants | Greece | 100.0 /100 | #35 | Exceptional 17.9% |
| Immigrants | South America | 100.0 /100 | #36 | Exceptional 17.9% |
| Immigrants | Croatia | 100.0 /100 | #37 | Exceptional 17.9% |
| South Americans | 100.0 /100 | #38 | Exceptional 18.0% |