Iroquois vs Czechoslovakian Single Father Poverty
COMPARE
Iroquois
Czechoslovakian
Single Father Poverty
Single Father Poverty Comparison
Iroquois
Czechoslovakians
17.7%
SINGLE FATHER POVERTY
0.0/ 100
METRIC RATING
279th/ 347
METRIC RANK
17.1%
SINGLE FATHER POVERTY
1.3/ 100
METRIC RATING
248th/ 347
METRIC RANK
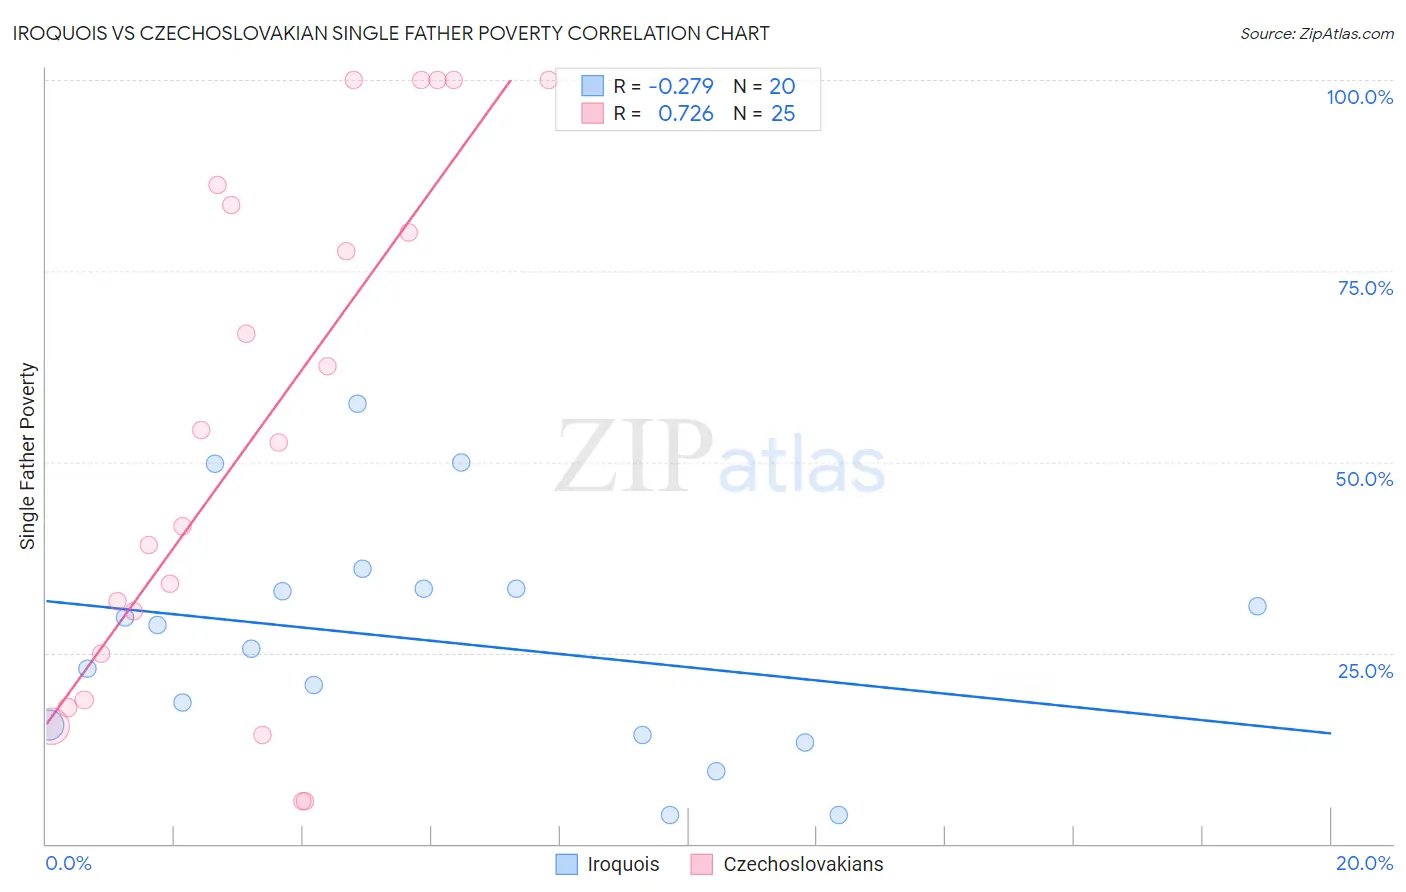
Iroquois vs Czechoslovakian Single Father Poverty Correlation Chart
The statistical analysis conducted on geographies consisting of 177,877,486 people shows a weak negative correlation between the proportion of Iroquois and poverty level among single fathers in the United States with a correlation coefficient (R) of -0.279 and weighted average of 17.7%. Similarly, the statistical analysis conducted on geographies consisting of 285,091,389 people shows a strong positive correlation between the proportion of Czechoslovakians and poverty level among single fathers in the United States with a correlation coefficient (R) of 0.726 and weighted average of 17.1%, a difference of 3.9%.
Single Father Poverty Correlation Summary
| Measurement | Iroquois | Czechoslovakian |
| Minimum | 3.8% | 5.5% |
| Maximum | 57.7% | 100.0% |
| Range | 53.9% | 94.5% |
| Mean | 26.5% | 53.7% |
| Median | 27.1% | 52.6% |
| Interquartile 25% (IQ1) | 14.8% | 21.8% |
| Interquartile 75% (IQ3) | 33.3% | 85.0% |
| Interquartile Range (IQR) | 18.5% | 63.1% |
| Standard Deviation (Sample) | 14.9% | 33.5% |
| Standard Deviation (Population) | 14.5% | 32.8% |
Similar Demographics by Single Father Poverty
Demographics Similar to Iroquois by Single Father Poverty
In terms of single father poverty, the demographic groups most similar to Iroquois are Scottish (17.7%, a difference of 0.050%), German (17.7%, a difference of 0.15%), Lebanese (17.7%, a difference of 0.16%), German Russian (17.7%, a difference of 0.31%), and British West Indian (17.7%, a difference of 0.37%).
| Demographics | Rating | Rank | Single Father Poverty |
| Barbadians | 0.1 /100 | #272 | Tragic 17.5% |
| Italians | 0.1 /100 | #273 | Tragic 17.5% |
| Macedonians | 0.1 /100 | #274 | Tragic 17.7% |
| British West Indians | 0.0 /100 | #275 | Tragic 17.7% |
| German Russians | 0.0 /100 | #276 | Tragic 17.7% |
| Lebanese | 0.0 /100 | #277 | Tragic 17.7% |
| Germans | 0.0 /100 | #278 | Tragic 17.7% |
| Iroquois | 0.0 /100 | #279 | Tragic 17.7% |
| Scottish | 0.0 /100 | #280 | Tragic 17.7% |
| English | 0.0 /100 | #281 | Tragic 17.8% |
| Dutch | 0.0 /100 | #282 | Tragic 17.8% |
| Alsatians | 0.0 /100 | #283 | Tragic 17.8% |
| Welsh | 0.0 /100 | #284 | Tragic 17.8% |
| Immigrants | Lebanon | 0.0 /100 | #285 | Tragic 17.9% |
| Immigrants | North Macedonia | 0.0 /100 | #286 | Tragic 17.9% |
Demographics Similar to Czechoslovakians by Single Father Poverty
In terms of single father poverty, the demographic groups most similar to Czechoslovakians are Greek (17.1%, a difference of 0.0%), Canadian (17.1%, a difference of 0.040%), Immigrants from Ireland (17.1%, a difference of 0.10%), Trinidadian and Tobagonian (17.0%, a difference of 0.14%), and Austrian (17.1%, a difference of 0.17%).
| Demographics | Rating | Rank | Single Father Poverty |
| Czechs | 2.3 /100 | #241 | Tragic 17.0% |
| Moroccans | 2.1 /100 | #242 | Tragic 17.0% |
| Immigrants | Cabo Verde | 1.6 /100 | #243 | Tragic 17.0% |
| Hondurans | 1.6 /100 | #244 | Tragic 17.0% |
| Trinidadians and Tobagonians | 1.5 /100 | #245 | Tragic 17.0% |
| Immigrants | Ireland | 1.4 /100 | #246 | Tragic 17.1% |
| Greeks | 1.3 /100 | #247 | Tragic 17.1% |
| Czechoslovakians | 1.3 /100 | #248 | Tragic 17.1% |
| Canadians | 1.3 /100 | #249 | Tragic 17.1% |
| Austrians | 1.1 /100 | #250 | Tragic 17.1% |
| Luxembourgers | 1.1 /100 | #251 | Tragic 17.1% |
| Croatians | 1.0 /100 | #252 | Tragic 17.1% |
| Cree | 1.0 /100 | #253 | Tragic 17.1% |
| Immigrants | Honduras | 0.9 /100 | #254 | Tragic 17.1% |
| Sierra Leoneans | 0.8 /100 | #255 | Tragic 17.2% |