Latvian vs Immigrants from Lithuania Single Father Poverty
COMPARE
Latvian
Immigrants from Lithuania
Single Father Poverty
Single Father Poverty Comparison
Latvians
Immigrants from Lithuania
16.5%
SINGLE FATHER POVERTY
28.9/ 100
METRIC RATING
189th/ 347
METRIC RANK
15.3%
SINGLE FATHER POVERTY
99.6/ 100
METRIC RATING
72nd/ 347
METRIC RANK
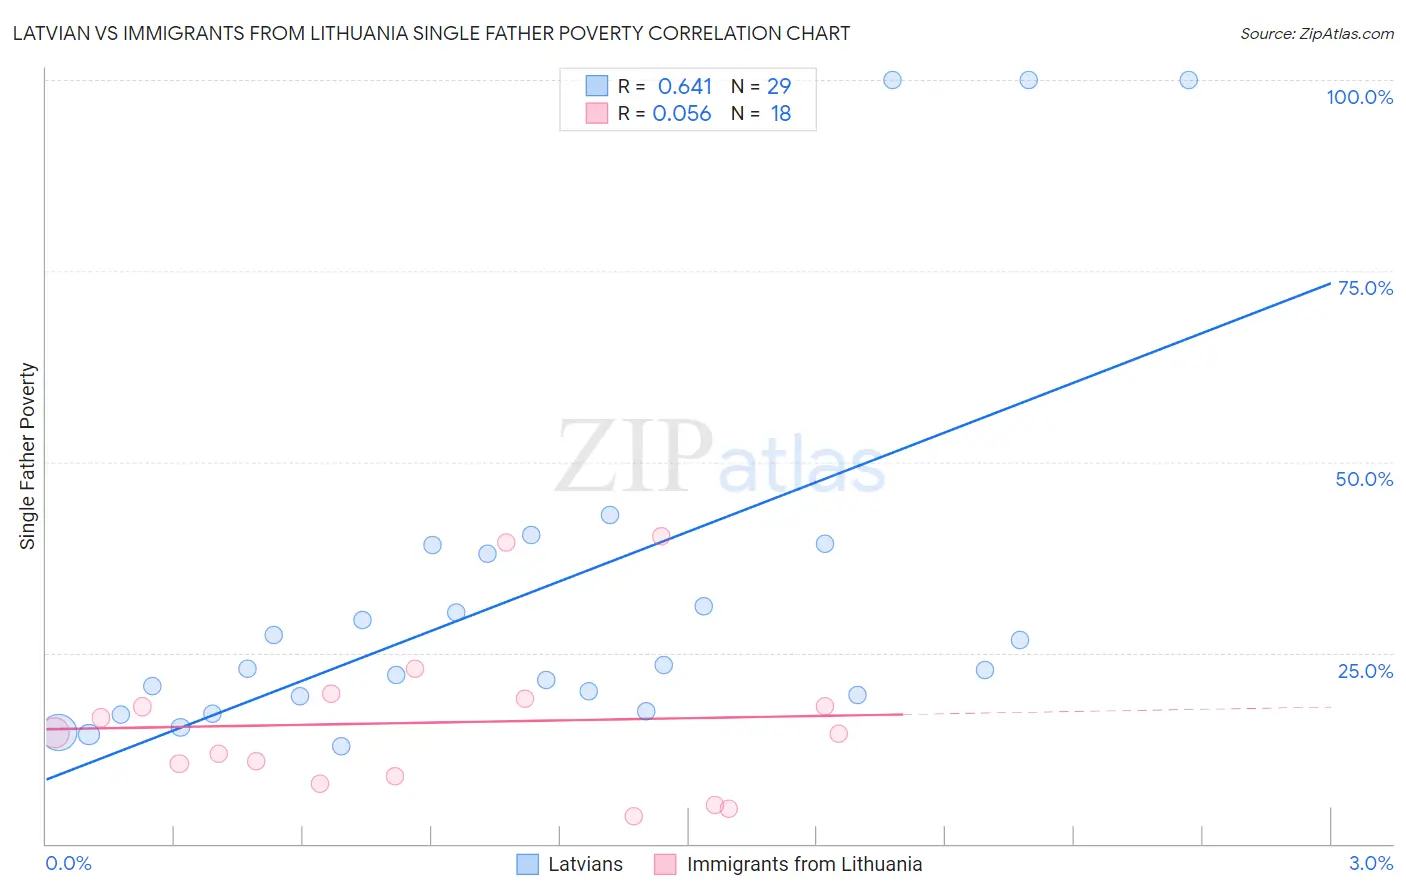
Latvian vs Immigrants from Lithuania Single Father Poverty Correlation Chart
The statistical analysis conducted on geographies consisting of 180,631,509 people shows a significant positive correlation between the proportion of Latvians and poverty level among single fathers in the United States with a correlation coefficient (R) of 0.641 and weighted average of 16.5%. Similarly, the statistical analysis conducted on geographies consisting of 100,005,444 people shows a slight positive correlation between the proportion of Immigrants from Lithuania and poverty level among single fathers in the United States with a correlation coefficient (R) of 0.056 and weighted average of 15.3%, a difference of 7.5%.
Single Father Poverty Correlation Summary
| Measurement | Latvian | Immigrants from Lithuania |
| Minimum | 12.7% | 3.6% |
| Maximum | 100.0% | 40.2% |
| Range | 87.3% | 36.6% |
| Mean | 32.6% | 15.9% |
| Median | 22.9% | 14.4% |
| Interquartile 25% (IQ1) | 18.3% | 8.9% |
| Interquartile 75% (IQ3) | 38.6% | 18.9% |
| Interquartile Range (IQR) | 20.2% | 10.1% |
| Standard Deviation (Sample) | 24.8% | 10.3% |
| Standard Deviation (Population) | 24.4% | 10.0% |
Similar Demographics by Single Father Poverty
Demographics Similar to Latvians by Single Father Poverty
In terms of single father poverty, the demographic groups most similar to Latvians are Immigrants from Burma/Myanmar (16.5%, a difference of 0.050%), Russian (16.4%, a difference of 0.060%), Ukrainian (16.4%, a difference of 0.080%), Immigrants from Guyana (16.5%, a difference of 0.10%), and Immigrants from Venezuela (16.4%, a difference of 0.11%).
| Demographics | Rating | Rank | Single Father Poverty |
| Immigrants | Italy | 35.7 /100 | #182 | Fair 16.4% |
| Aleuts | 35.3 /100 | #183 | Fair 16.4% |
| Cambodians | 34.6 /100 | #184 | Fair 16.4% |
| Panamanians | 33.6 /100 | #185 | Fair 16.4% |
| Immigrants | Venezuela | 31.0 /100 | #186 | Fair 16.4% |
| Ukrainians | 30.4 /100 | #187 | Fair 16.4% |
| Russians | 30.1 /100 | #188 | Fair 16.4% |
| Latvians | 28.9 /100 | #189 | Fair 16.5% |
| Immigrants | Burma/Myanmar | 28.0 /100 | #190 | Fair 16.5% |
| Immigrants | Guyana | 27.1 /100 | #191 | Fair 16.5% |
| Immigrants | Switzerland | 24.8 /100 | #192 | Fair 16.5% |
| Ecuadorians | 24.5 /100 | #193 | Fair 16.5% |
| Cape Verdeans | 24.4 /100 | #194 | Fair 16.5% |
| Immigrants | Barbados | 24.3 /100 | #195 | Fair 16.5% |
| Immigrants | Canada | 21.9 /100 | #196 | Fair 16.5% |
Demographics Similar to Immigrants from Lithuania by Single Father Poverty
In terms of single father poverty, the demographic groups most similar to Immigrants from Lithuania are Kenyan (15.3%, a difference of 0.090%), Immigrants from Brazil (15.3%, a difference of 0.12%), Maltese (15.3%, a difference of 0.13%), Immigrants from Turkey (15.3%, a difference of 0.15%), and Immigrants from Japan (15.3%, a difference of 0.23%).
| Demographics | Rating | Rank | Single Father Poverty |
| Immigrants | Malaysia | 99.8 /100 | #65 | Exceptional 15.2% |
| Immigrants | Moldova | 99.8 /100 | #66 | Exceptional 15.2% |
| Paraguayans | 99.7 /100 | #67 | Exceptional 15.2% |
| Immigrants | Cameroon | 99.7 /100 | #68 | Exceptional 15.2% |
| Japanese | 99.7 /100 | #69 | Exceptional 15.2% |
| Mongolians | 99.7 /100 | #70 | Exceptional 15.3% |
| Immigrants | Brazil | 99.6 /100 | #71 | Exceptional 15.3% |
| Immigrants | Lithuania | 99.6 /100 | #72 | Exceptional 15.3% |
| Kenyans | 99.6 /100 | #73 | Exceptional 15.3% |
| Maltese | 99.6 /100 | #74 | Exceptional 15.3% |
| Immigrants | Turkey | 99.5 /100 | #75 | Exceptional 15.3% |
| Immigrants | Japan | 99.5 /100 | #76 | Exceptional 15.3% |
| Immigrants | Peru | 99.5 /100 | #77 | Exceptional 15.3% |
| Tlingit-Haida | 99.5 /100 | #78 | Exceptional 15.3% |
| Immigrants | Northern Africa | 99.5 /100 | #79 | Exceptional 15.3% |