Iroquois vs Immigrants from Eastern Asia Single Father Poverty
COMPARE
Iroquois
Immigrants from Eastern Asia
Single Father Poverty
Single Father Poverty Comparison
Iroquois
Immigrants from Eastern Asia
17.7%
SINGLE FATHER POVERTY
0.0/ 100
METRIC RATING
279th/ 347
METRIC RANK
15.0%
SINGLE FATHER POVERTY
99.9/ 100
METRIC RATING
49th/ 347
METRIC RANK
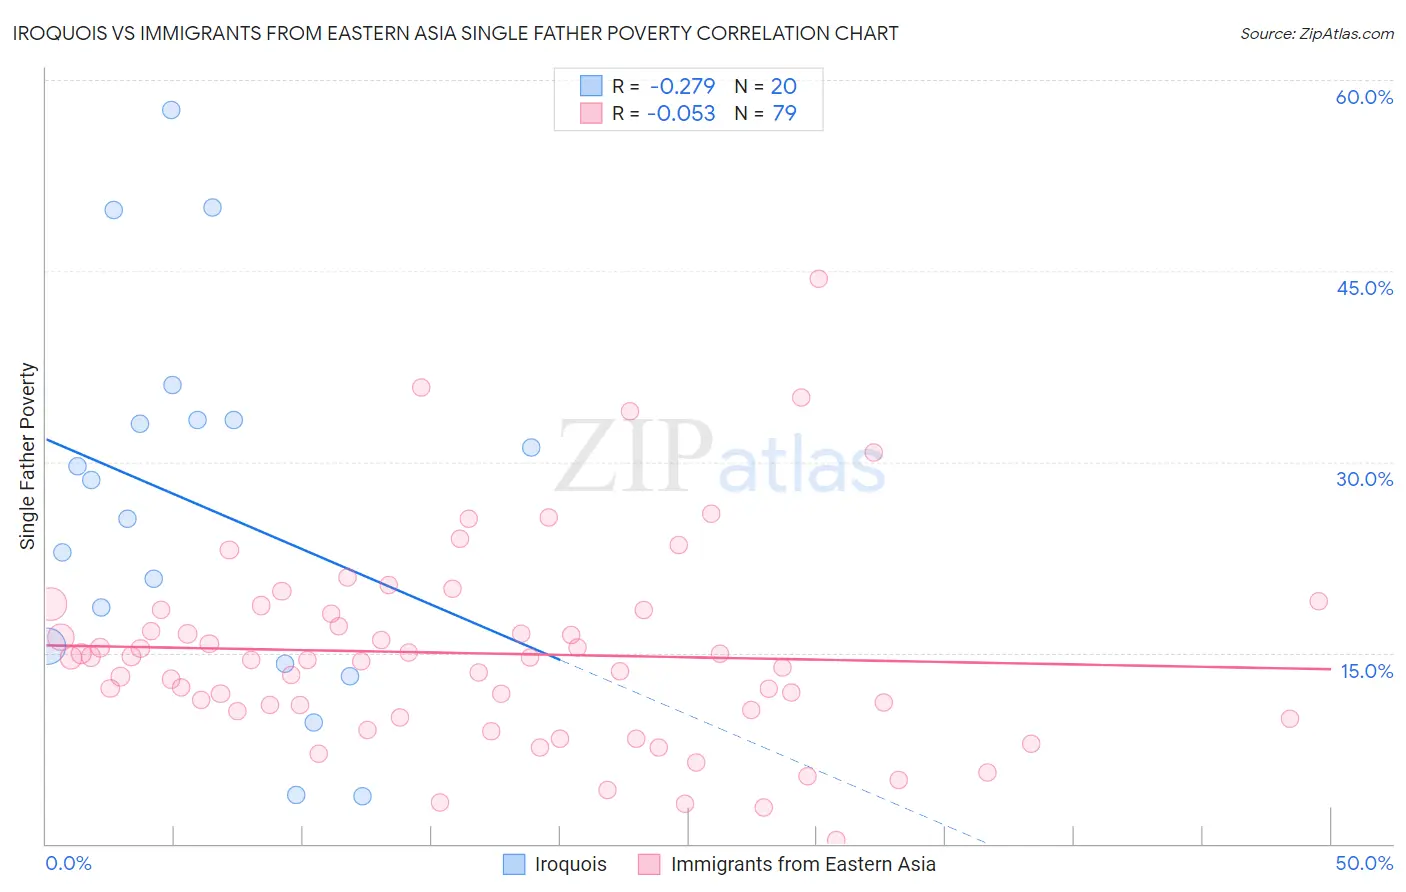
Iroquois vs Immigrants from Eastern Asia Single Father Poverty Correlation Chart
The statistical analysis conducted on geographies consisting of 177,877,486 people shows a weak negative correlation between the proportion of Iroquois and poverty level among single fathers in the United States with a correlation coefficient (R) of -0.279 and weighted average of 17.7%. Similarly, the statistical analysis conducted on geographies consisting of 375,066,761 people shows a slight negative correlation between the proportion of Immigrants from Eastern Asia and poverty level among single fathers in the United States with a correlation coefficient (R) of -0.053 and weighted average of 15.0%, a difference of 18.6%.
Single Father Poverty Correlation Summary
| Measurement | Iroquois | Immigrants from Eastern Asia |
| Minimum | 3.8% | 0.30% |
| Maximum | 57.7% | 44.3% |
| Range | 53.9% | 44.0% |
| Mean | 26.5% | 15.0% |
| Median | 27.1% | 14.5% |
| Interquartile 25% (IQ1) | 14.8% | 10.4% |
| Interquartile 75% (IQ3) | 33.3% | 18.3% |
| Interquartile Range (IQR) | 18.5% | 8.0% |
| Standard Deviation (Sample) | 14.9% | 7.9% |
| Standard Deviation (Population) | 14.5% | 7.8% |
Similar Demographics by Single Father Poverty
Demographics Similar to Iroquois by Single Father Poverty
In terms of single father poverty, the demographic groups most similar to Iroquois are Scottish (17.7%, a difference of 0.050%), German (17.7%, a difference of 0.15%), Lebanese (17.7%, a difference of 0.16%), German Russian (17.7%, a difference of 0.31%), and British West Indian (17.7%, a difference of 0.37%).
| Demographics | Rating | Rank | Single Father Poverty |
| Barbadians | 0.1 /100 | #272 | Tragic 17.5% |
| Italians | 0.1 /100 | #273 | Tragic 17.5% |
| Macedonians | 0.1 /100 | #274 | Tragic 17.7% |
| British West Indians | 0.0 /100 | #275 | Tragic 17.7% |
| German Russians | 0.0 /100 | #276 | Tragic 17.7% |
| Lebanese | 0.0 /100 | #277 | Tragic 17.7% |
| Germans | 0.0 /100 | #278 | Tragic 17.7% |
| Iroquois | 0.0 /100 | #279 | Tragic 17.7% |
| Scottish | 0.0 /100 | #280 | Tragic 17.7% |
| English | 0.0 /100 | #281 | Tragic 17.8% |
| Dutch | 0.0 /100 | #282 | Tragic 17.8% |
| Alsatians | 0.0 /100 | #283 | Tragic 17.8% |
| Welsh | 0.0 /100 | #284 | Tragic 17.8% |
| Immigrants | Lebanon | 0.0 /100 | #285 | Tragic 17.9% |
| Immigrants | North Macedonia | 0.0 /100 | #286 | Tragic 17.9% |
Demographics Similar to Immigrants from Eastern Asia by Single Father Poverty
In terms of single father poverty, the demographic groups most similar to Immigrants from Eastern Asia are Bhutanese (15.0%, a difference of 0.050%), Immigrants from Pakistan (15.0%, a difference of 0.070%), Immigrants from El Salvador (15.0%, a difference of 0.11%), Immigrants from Kenya (15.0%, a difference of 0.14%), and Immigrants from China (14.9%, a difference of 0.16%).
| Demographics | Rating | Rank | Single Father Poverty |
| Immigrants | Nepal | 100.0 /100 | #42 | Exceptional 14.8% |
| Immigrants | Eritrea | 100.0 /100 | #43 | Exceptional 14.8% |
| Salvadorans | 100.0 /100 | #44 | Exceptional 14.9% |
| Immigrants | Somalia | 100.0 /100 | #45 | Exceptional 14.9% |
| Immigrants | Cambodia | 99.9 /100 | #46 | Exceptional 14.9% |
| Immigrants | China | 99.9 /100 | #47 | Exceptional 14.9% |
| Malaysians | 99.9 /100 | #48 | Exceptional 14.9% |
| Immigrants | Eastern Asia | 99.9 /100 | #49 | Exceptional 15.0% |
| Bhutanese | 99.9 /100 | #50 | Exceptional 15.0% |
| Immigrants | Pakistan | 99.9 /100 | #51 | Exceptional 15.0% |
| Immigrants | El Salvador | 99.9 /100 | #52 | Exceptional 15.0% |
| Immigrants | Kenya | 99.9 /100 | #53 | Exceptional 15.0% |
| Immigrants | Uzbekistan | 99.9 /100 | #54 | Exceptional 15.0% |
| Immigrants | Bulgaria | 99.9 /100 | #55 | Exceptional 15.0% |
| Immigrants | Laos | 99.9 /100 | #56 | Exceptional 15.1% |