Nicaraguan vs Immigrants from Lithuania Single Father Poverty
COMPARE
Nicaraguan
Immigrants from Lithuania
Single Father Poverty
Single Father Poverty Comparison
Nicaraguans
Immigrants from Lithuania
15.9%
SINGLE FATHER POVERTY
90.1/ 100
METRIC RATING
131st/ 347
METRIC RANK
15.3%
SINGLE FATHER POVERTY
99.6/ 100
METRIC RATING
72nd/ 347
METRIC RANK
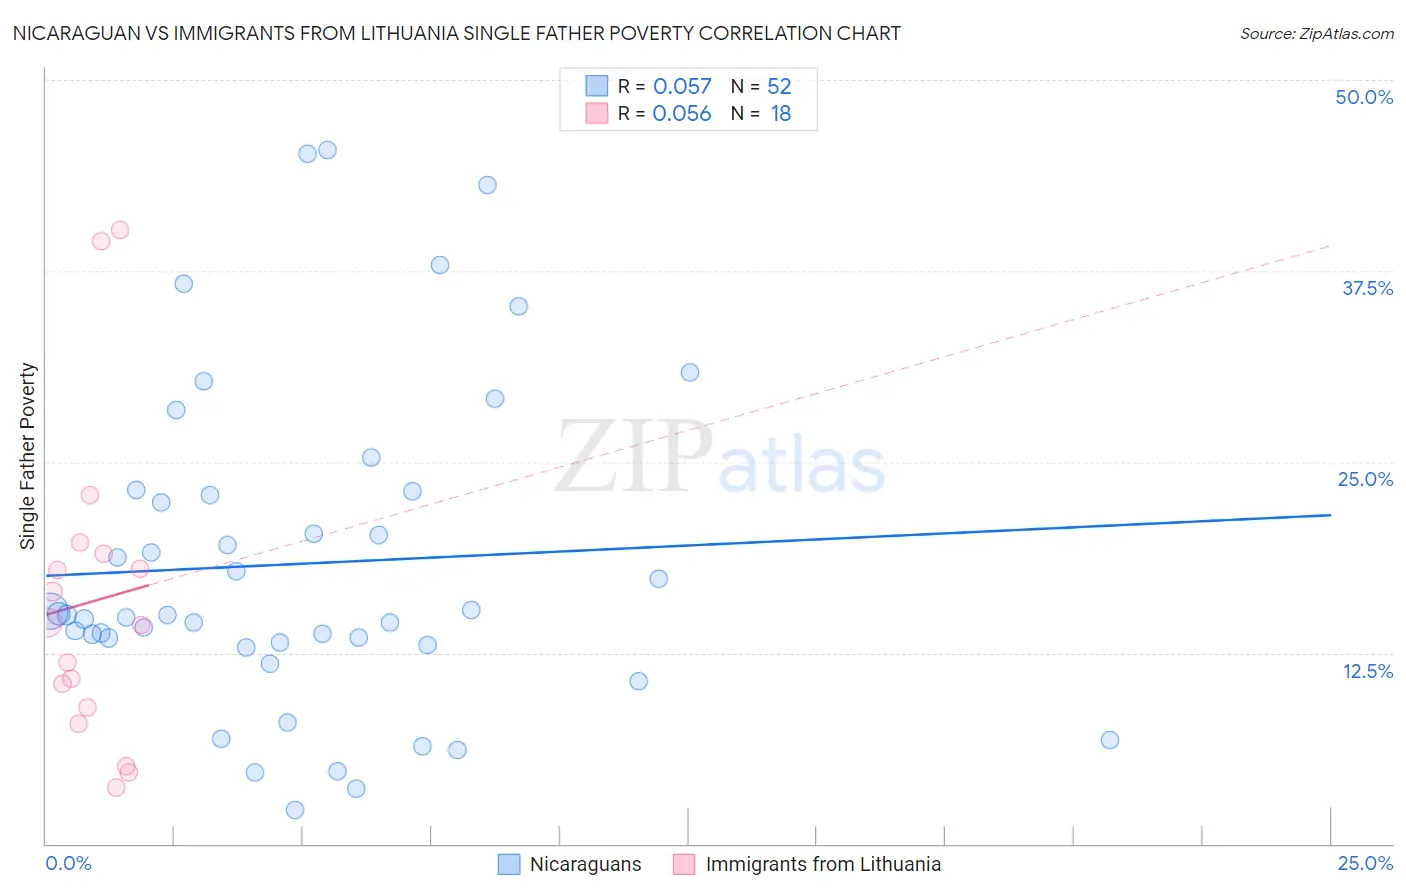
Nicaraguan vs Immigrants from Lithuania Single Father Poverty Correlation Chart
The statistical analysis conducted on geographies consisting of 241,925,601 people shows a slight positive correlation between the proportion of Nicaraguans and poverty level among single fathers in the United States with a correlation coefficient (R) of 0.057 and weighted average of 15.9%. Similarly, the statistical analysis conducted on geographies consisting of 100,005,444 people shows a slight positive correlation between the proportion of Immigrants from Lithuania and poverty level among single fathers in the United States with a correlation coefficient (R) of 0.056 and weighted average of 15.3%, a difference of 3.9%.
Single Father Poverty Correlation Summary
| Measurement | Nicaraguan | Immigrants from Lithuania |
| Minimum | 2.2% | 3.6% |
| Maximum | 45.5% | 40.2% |
| Range | 43.2% | 36.6% |
| Mean | 18.3% | 15.9% |
| Median | 15.0% | 14.4% |
| Interquartile 25% (IQ1) | 13.1% | 8.9% |
| Interquartile 75% (IQ3) | 23.0% | 18.9% |
| Interquartile Range (IQR) | 9.9% | 10.1% |
| Standard Deviation (Sample) | 10.6% | 10.3% |
| Standard Deviation (Population) | 10.5% | 10.0% |
Similar Demographics by Single Father Poverty
Demographics Similar to Nicaraguans by Single Father Poverty
In terms of single father poverty, the demographic groups most similar to Nicaraguans are Norwegian (15.9%, a difference of 0.0%), Immigrants from Portugal (15.9%, a difference of 0.060%), Immigrants from Syria (15.9%, a difference of 0.070%), Immigrants from West Indies (15.9%, a difference of 0.080%), and Immigrants from Nigeria (15.9%, a difference of 0.090%).
| Demographics | Rating | Rank | Single Father Poverty |
| Immigrants | Panama | 91.3 /100 | #124 | Exceptional 15.9% |
| Iraqis | 91.2 /100 | #125 | Exceptional 15.9% |
| Hmong | 91.1 /100 | #126 | Exceptional 15.9% |
| Immigrants | Liberia | 91.1 /100 | #127 | Exceptional 15.9% |
| Immigrants | Nigeria | 90.8 /100 | #128 | Exceptional 15.9% |
| Immigrants | West Indies | 90.8 /100 | #129 | Exceptional 15.9% |
| Norwegians | 90.2 /100 | #130 | Exceptional 15.9% |
| Nicaraguans | 90.1 /100 | #131 | Exceptional 15.9% |
| Immigrants | Portugal | 89.7 /100 | #132 | Excellent 15.9% |
| Immigrants | Syria | 89.5 /100 | #133 | Excellent 15.9% |
| Immigrants | South America | 88.5 /100 | #134 | Excellent 15.9% |
| Immigrants | Sri Lanka | 88.2 /100 | #135 | Excellent 15.9% |
| Cypriots | 87.5 /100 | #136 | Excellent 15.9% |
| Immigrants | Azores | 87.2 /100 | #137 | Excellent 15.9% |
| Central Americans | 87.1 /100 | #138 | Excellent 16.0% |
Demographics Similar to Immigrants from Lithuania by Single Father Poverty
In terms of single father poverty, the demographic groups most similar to Immigrants from Lithuania are Kenyan (15.3%, a difference of 0.090%), Immigrants from Brazil (15.3%, a difference of 0.12%), Maltese (15.3%, a difference of 0.13%), Immigrants from Turkey (15.3%, a difference of 0.15%), and Immigrants from Japan (15.3%, a difference of 0.23%).
| Demographics | Rating | Rank | Single Father Poverty |
| Immigrants | Malaysia | 99.8 /100 | #65 | Exceptional 15.2% |
| Immigrants | Moldova | 99.8 /100 | #66 | Exceptional 15.2% |
| Paraguayans | 99.7 /100 | #67 | Exceptional 15.2% |
| Immigrants | Cameroon | 99.7 /100 | #68 | Exceptional 15.2% |
| Japanese | 99.7 /100 | #69 | Exceptional 15.2% |
| Mongolians | 99.7 /100 | #70 | Exceptional 15.3% |
| Immigrants | Brazil | 99.6 /100 | #71 | Exceptional 15.3% |
| Immigrants | Lithuania | 99.6 /100 | #72 | Exceptional 15.3% |
| Kenyans | 99.6 /100 | #73 | Exceptional 15.3% |
| Maltese | 99.6 /100 | #74 | Exceptional 15.3% |
| Immigrants | Turkey | 99.5 /100 | #75 | Exceptional 15.3% |
| Immigrants | Japan | 99.5 /100 | #76 | Exceptional 15.3% |
| Immigrants | Peru | 99.5 /100 | #77 | Exceptional 15.3% |
| Tlingit-Haida | 99.5 /100 | #78 | Exceptional 15.3% |
| Immigrants | Northern Africa | 99.5 /100 | #79 | Exceptional 15.3% |