Japanese vs Immigrants from Lithuania Single Father Poverty
COMPARE
Japanese
Immigrants from Lithuania
Single Father Poverty
Single Father Poverty Comparison
Japanese
Immigrants from Lithuania
15.2%
SINGLE FATHER POVERTY
99.7/ 100
METRIC RATING
69th/ 347
METRIC RANK
15.3%
SINGLE FATHER POVERTY
99.6/ 100
METRIC RATING
72nd/ 347
METRIC RANK
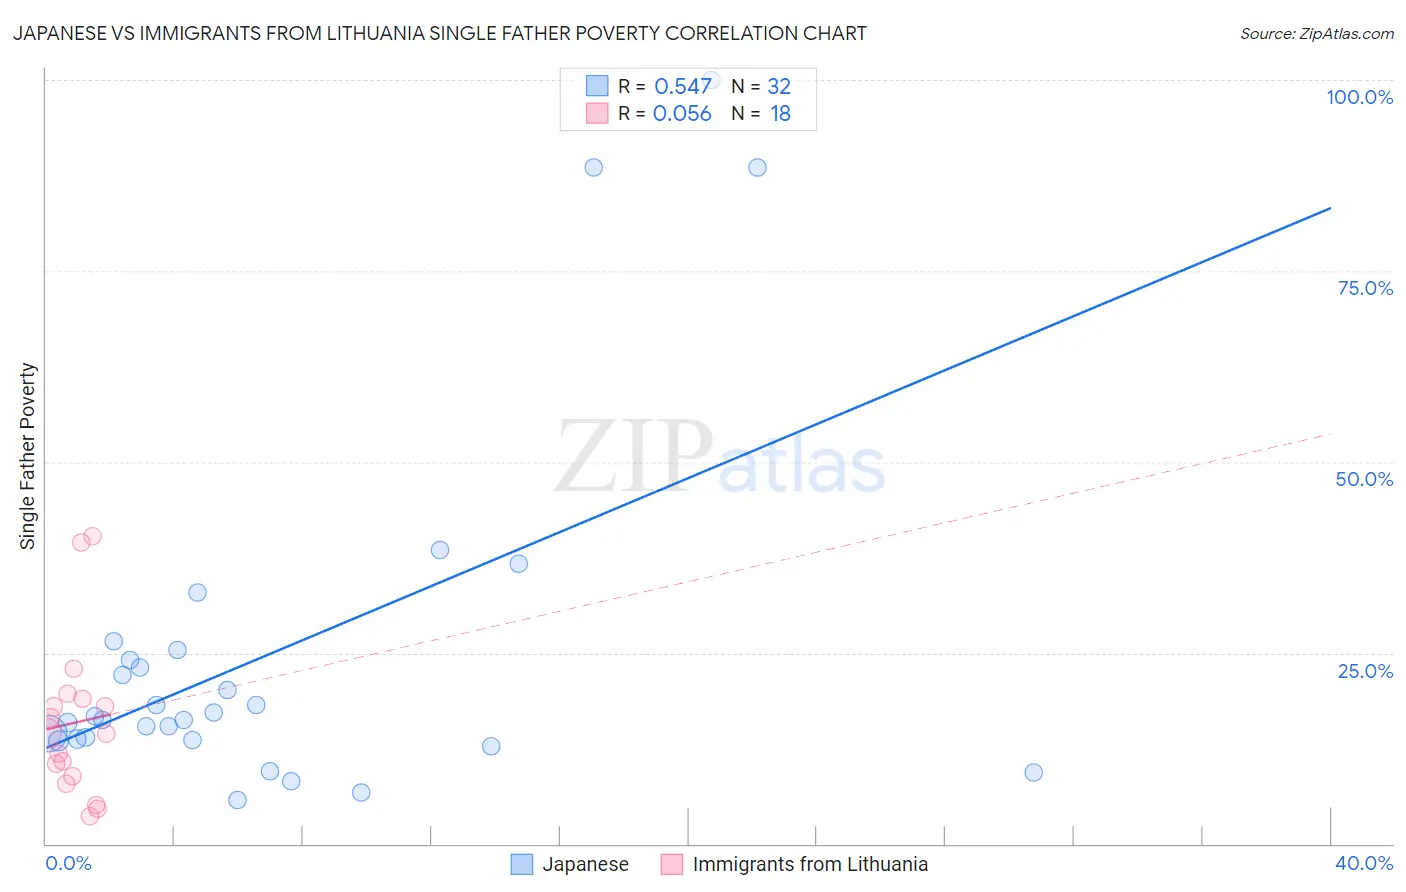
Japanese vs Immigrants from Lithuania Single Father Poverty Correlation Chart
The statistical analysis conducted on geographies consisting of 212,212,459 people shows a substantial positive correlation between the proportion of Japanese and poverty level among single fathers in the United States with a correlation coefficient (R) of 0.547 and weighted average of 15.2%. Similarly, the statistical analysis conducted on geographies consisting of 100,005,444 people shows a slight positive correlation between the proportion of Immigrants from Lithuania and poverty level among single fathers in the United States with a correlation coefficient (R) of 0.056 and weighted average of 15.3%, a difference of 0.44%.
Single Father Poverty Correlation Summary
| Measurement | Japanese | Immigrants from Lithuania |
| Minimum | 5.7% | 3.6% |
| Maximum | 100.0% | 40.2% |
| Range | 94.3% | 36.6% |
| Mean | 24.9% | 15.9% |
| Median | 16.5% | 14.4% |
| Interquartile 25% (IQ1) | 13.6% | 8.9% |
| Interquartile 75% (IQ3) | 24.7% | 18.9% |
| Interquartile Range (IQR) | 11.1% | 10.1% |
| Standard Deviation (Sample) | 23.4% | 10.3% |
| Standard Deviation (Population) | 23.1% | 10.0% |
Demographics Similar to Japanese and Immigrants from Lithuania by Single Father Poverty
In terms of single father poverty, the demographic groups most similar to Japanese are Immigrants from Cameroon (15.2%, a difference of 0.030%), Mongolian (15.3%, a difference of 0.10%), Paraguayan (15.2%, a difference of 0.11%), Immigrants from Moldova (15.2%, a difference of 0.20%), and Immigrants from Malaysia (15.2%, a difference of 0.23%). Similarly, the demographic groups most similar to Immigrants from Lithuania are Kenyan (15.3%, a difference of 0.090%), Immigrants from Brazil (15.3%, a difference of 0.12%), Maltese (15.3%, a difference of 0.13%), Immigrants from Turkey (15.3%, a difference of 0.15%), and Immigrants from Japan (15.3%, a difference of 0.23%).
| Demographics | Rating | Rank | Single Father Poverty |
| Puget Sound Salish | 99.8 /100 | #60 | Exceptional 15.2% |
| Immigrants | Bosnia and Herzegovina | 99.8 /100 | #61 | Exceptional 15.2% |
| Immigrants | Armenia | 99.8 /100 | #62 | Exceptional 15.2% |
| Immigrants | Sweden | 99.8 /100 | #63 | Exceptional 15.2% |
| Bangladeshis | 99.8 /100 | #64 | Exceptional 15.2% |
| Immigrants | Malaysia | 99.8 /100 | #65 | Exceptional 15.2% |
| Immigrants | Moldova | 99.8 /100 | #66 | Exceptional 15.2% |
| Paraguayans | 99.7 /100 | #67 | Exceptional 15.2% |
| Immigrants | Cameroon | 99.7 /100 | #68 | Exceptional 15.2% |
| Japanese | 99.7 /100 | #69 | Exceptional 15.2% |
| Mongolians | 99.7 /100 | #70 | Exceptional 15.3% |
| Immigrants | Brazil | 99.6 /100 | #71 | Exceptional 15.3% |
| Immigrants | Lithuania | 99.6 /100 | #72 | Exceptional 15.3% |
| Kenyans | 99.6 /100 | #73 | Exceptional 15.3% |
| Maltese | 99.6 /100 | #74 | Exceptional 15.3% |
| Immigrants | Turkey | 99.5 /100 | #75 | Exceptional 15.3% |
| Immigrants | Japan | 99.5 /100 | #76 | Exceptional 15.3% |
| Immigrants | Peru | 99.5 /100 | #77 | Exceptional 15.3% |
| Tlingit-Haida | 99.5 /100 | #78 | Exceptional 15.3% |
| Immigrants | Northern Africa | 99.5 /100 | #79 | Exceptional 15.3% |
| Armenians | 99.4 /100 | #80 | Exceptional 15.4% |