Hungarian vs Immigrants from Lithuania Single Father Poverty
COMPARE
Hungarian
Immigrants from Lithuania
Single Father Poverty
Single Father Poverty Comparison
Hungarians
Immigrants from Lithuania
18.5%
SINGLE FATHER POVERTY
0.0/ 100
METRIC RATING
301st/ 347
METRIC RANK
15.3%
SINGLE FATHER POVERTY
99.6/ 100
METRIC RATING
72nd/ 347
METRIC RANK
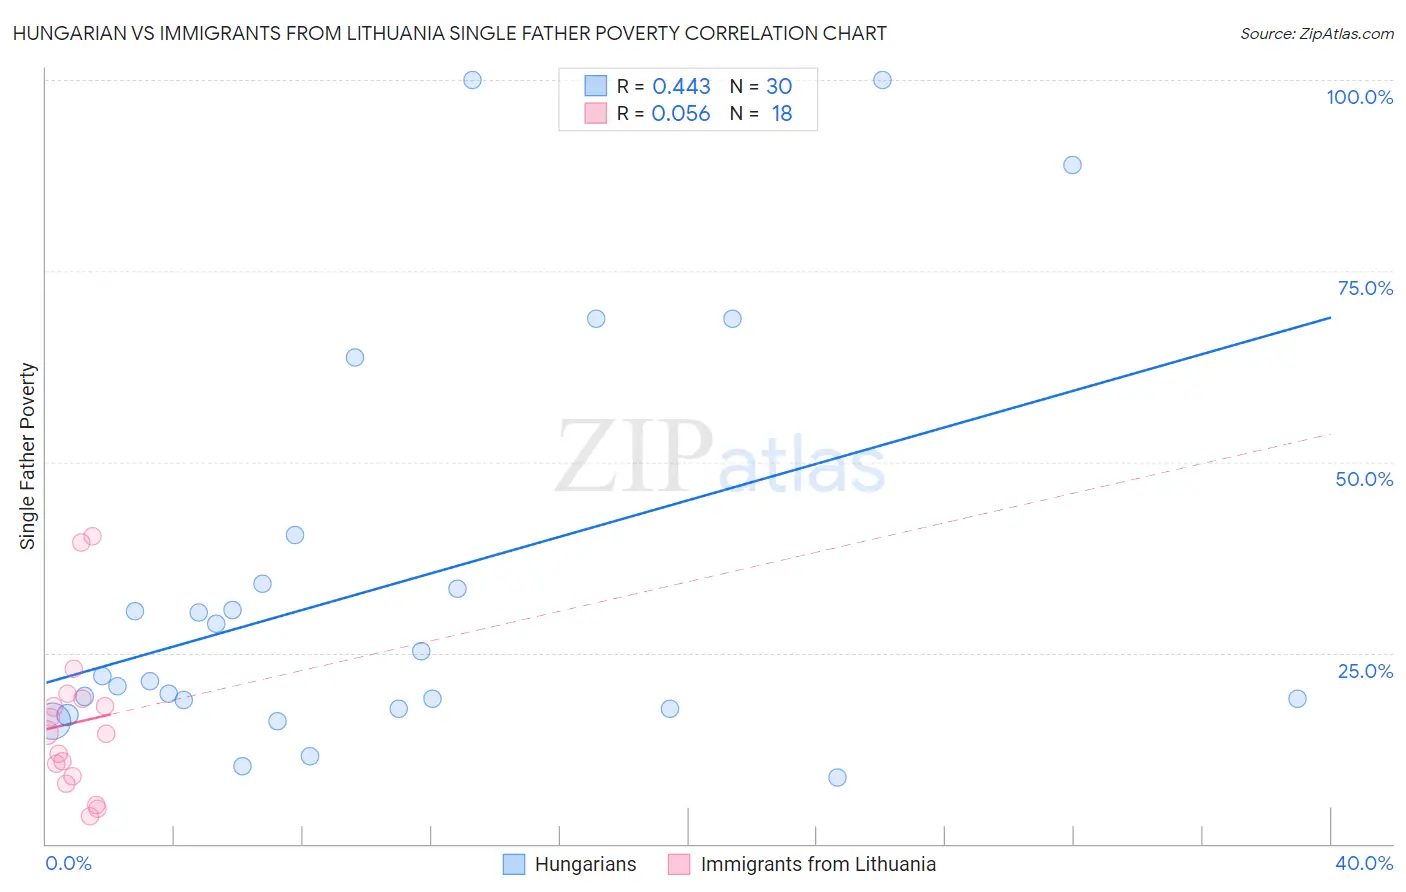
Hungarian vs Immigrants from Lithuania Single Father Poverty Correlation Chart
The statistical analysis conducted on geographies consisting of 362,286,644 people shows a moderate positive correlation between the proportion of Hungarians and poverty level among single fathers in the United States with a correlation coefficient (R) of 0.443 and weighted average of 18.5%. Similarly, the statistical analysis conducted on geographies consisting of 100,005,444 people shows a slight positive correlation between the proportion of Immigrants from Lithuania and poverty level among single fathers in the United States with a correlation coefficient (R) of 0.056 and weighted average of 15.3%, a difference of 20.6%.
Single Father Poverty Correlation Summary
| Measurement | Hungarian | Immigrants from Lithuania |
| Minimum | 8.6% | 3.6% |
| Maximum | 100.0% | 40.2% |
| Range | 91.4% | 36.6% |
| Mean | 33.9% | 15.9% |
| Median | 21.6% | 14.4% |
| Interquartile 25% (IQ1) | 17.7% | 8.9% |
| Interquartile 75% (IQ3) | 34.0% | 18.9% |
| Interquartile Range (IQR) | 16.3% | 10.1% |
| Standard Deviation (Sample) | 26.2% | 10.3% |
| Standard Deviation (Population) | 25.8% | 10.0% |
Similar Demographics by Single Father Poverty
Demographics Similar to Hungarians by Single Father Poverty
In terms of single father poverty, the demographic groups most similar to Hungarians are Comanche (18.5%, a difference of 0.11%), Celtic (18.5%, a difference of 0.15%), Immigrants from Dominican Republic (18.4%, a difference of 0.22%), Ute (18.5%, a difference of 0.29%), and Blackfeet (18.5%, a difference of 0.34%).
| Demographics | Rating | Rank | Single Father Poverty |
| U.S. Virgin Islanders | 0.0 /100 | #294 | Tragic 18.1% |
| Yakama | 0.0 /100 | #295 | Tragic 18.1% |
| Seminole | 0.0 /100 | #296 | Tragic 18.1% |
| French | 0.0 /100 | #297 | Tragic 18.2% |
| Africans | 0.0 /100 | #298 | Tragic 18.3% |
| Whites/Caucasians | 0.0 /100 | #299 | Tragic 18.4% |
| Immigrants | Dominican Republic | 0.0 /100 | #300 | Tragic 18.4% |
| Hungarians | 0.0 /100 | #301 | Tragic 18.5% |
| Comanche | 0.0 /100 | #302 | Tragic 18.5% |
| Celtics | 0.0 /100 | #303 | Tragic 18.5% |
| Ute | 0.0 /100 | #304 | Tragic 18.5% |
| Blackfeet | 0.0 /100 | #305 | Tragic 18.5% |
| Scotch-Irish | 0.0 /100 | #306 | Tragic 18.6% |
| French Canadians | 0.0 /100 | #307 | Tragic 18.6% |
| Ottawa | 0.0 /100 | #308 | Tragic 18.6% |
Demographics Similar to Immigrants from Lithuania by Single Father Poverty
In terms of single father poverty, the demographic groups most similar to Immigrants from Lithuania are Kenyan (15.3%, a difference of 0.090%), Immigrants from Brazil (15.3%, a difference of 0.12%), Maltese (15.3%, a difference of 0.13%), Immigrants from Turkey (15.3%, a difference of 0.15%), and Immigrants from Japan (15.3%, a difference of 0.23%).
| Demographics | Rating | Rank | Single Father Poverty |
| Immigrants | Malaysia | 99.8 /100 | #65 | Exceptional 15.2% |
| Immigrants | Moldova | 99.8 /100 | #66 | Exceptional 15.2% |
| Paraguayans | 99.7 /100 | #67 | Exceptional 15.2% |
| Immigrants | Cameroon | 99.7 /100 | #68 | Exceptional 15.2% |
| Japanese | 99.7 /100 | #69 | Exceptional 15.2% |
| Mongolians | 99.7 /100 | #70 | Exceptional 15.3% |
| Immigrants | Brazil | 99.6 /100 | #71 | Exceptional 15.3% |
| Immigrants | Lithuania | 99.6 /100 | #72 | Exceptional 15.3% |
| Kenyans | 99.6 /100 | #73 | Exceptional 15.3% |
| Maltese | 99.6 /100 | #74 | Exceptional 15.3% |
| Immigrants | Turkey | 99.5 /100 | #75 | Exceptional 15.3% |
| Immigrants | Japan | 99.5 /100 | #76 | Exceptional 15.3% |
| Immigrants | Peru | 99.5 /100 | #77 | Exceptional 15.3% |
| Tlingit-Haida | 99.5 /100 | #78 | Exceptional 15.3% |
| Immigrants | Northern Africa | 99.5 /100 | #79 | Exceptional 15.3% |