Immigrants from Yemen vs Immigrants from Lithuania Poverty
COMPARE
Immigrants from Yemen
Immigrants from Lithuania
Poverty
Poverty Comparison
Immigrants from Yemen
Immigrants from Lithuania
21.5%
POVERTY
0.0/ 100
METRIC RATING
342nd/ 347
METRIC RANK
10.3%
POVERTY
99.9/ 100
METRIC RATING
11th/ 347
METRIC RANK
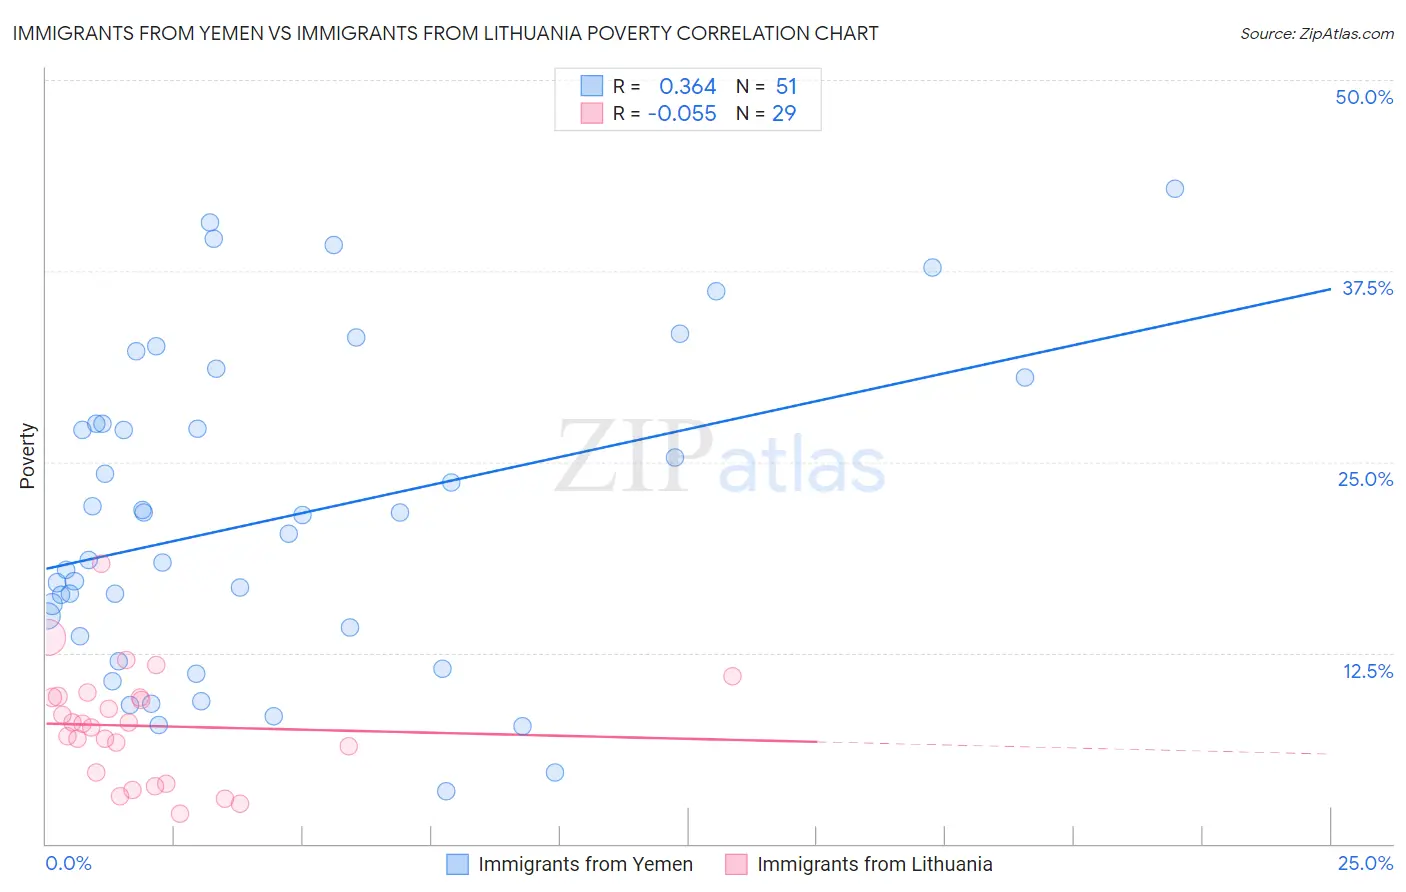
Immigrants from Yemen vs Immigrants from Lithuania Poverty Correlation Chart
The statistical analysis conducted on geographies consisting of 82,433,611 people shows a mild positive correlation between the proportion of Immigrants from Yemen and poverty level in the United States with a correlation coefficient (R) of 0.364 and weighted average of 21.5%. Similarly, the statistical analysis conducted on geographies consisting of 117,712,051 people shows a slight negative correlation between the proportion of Immigrants from Lithuania and poverty level in the United States with a correlation coefficient (R) of -0.055 and weighted average of 10.3%, a difference of 107.9%.
Poverty Correlation Summary
| Measurement | Immigrants from Yemen | Immigrants from Lithuania |
| Minimum | 3.5% | 2.0% |
| Maximum | 42.9% | 18.3% |
| Range | 39.4% | 16.4% |
| Mean | 21.3% | 7.7% |
| Median | 20.3% | 7.9% |
| Interquartile 25% (IQ1) | 13.6% | 4.3% |
| Interquartile 75% (IQ3) | 27.5% | 9.6% |
| Interquartile Range (IQR) | 13.9% | 5.3% |
| Standard Deviation (Sample) | 10.2% | 3.7% |
| Standard Deviation (Population) | 10.1% | 3.6% |
Similar Demographics by Poverty
Demographics Similar to Immigrants from Yemen by Poverty
In terms of poverty, the demographic groups most similar to Immigrants from Yemen are Pima (21.9%, a difference of 1.6%), Lumbee (21.9%, a difference of 1.9%), Hopi (20.8%, a difference of 3.2%), Yup'ik (20.8%, a difference of 3.4%), and Crow (20.7%, a difference of 4.1%).
| Demographics | Rating | Rank | Poverty |
| Houma | 0.0 /100 | #333 | Tragic 18.4% |
| Apache | 0.0 /100 | #334 | Tragic 18.4% |
| Cheyenne | 0.0 /100 | #335 | Tragic 18.9% |
| Pueblo | 0.0 /100 | #336 | Tragic 19.4% |
| Sioux | 0.0 /100 | #337 | Tragic 19.8% |
| Yuman | 0.0 /100 | #338 | Tragic 20.2% |
| Crow | 0.0 /100 | #339 | Tragic 20.7% |
| Yup'ik | 0.0 /100 | #340 | Tragic 20.8% |
| Hopi | 0.0 /100 | #341 | Tragic 20.8% |
| Immigrants | Yemen | 0.0 /100 | #342 | Tragic 21.5% |
| Pima | 0.0 /100 | #343 | Tragic 21.9% |
| Lumbee | 0.0 /100 | #344 | Tragic 21.9% |
| Navajo | 0.0 /100 | #345 | Tragic 23.1% |
| Puerto Ricans | 0.0 /100 | #346 | Tragic 23.7% |
| Tohono O'odham | 0.0 /100 | #347 | Tragic 24.4% |
Demographics Similar to Immigrants from Lithuania by Poverty
In terms of poverty, the demographic groups most similar to Immigrants from Lithuania are Bhutanese (10.4%, a difference of 0.35%), Immigrants from Hong Kong (10.4%, a difference of 0.57%), Immigrants from Bolivia (10.4%, a difference of 0.89%), Bolivian (10.4%, a difference of 0.89%), and Bulgarian (10.2%, a difference of 0.99%).
| Demographics | Rating | Rank | Poverty |
| Immigrants | Taiwan | 100.0 /100 | #4 | Exceptional 9.7% |
| Immigrants | Ireland | 99.9 /100 | #5 | Exceptional 10.1% |
| Assyrians/Chaldeans/Syriacs | 99.9 /100 | #6 | Exceptional 10.1% |
| Filipinos | 99.9 /100 | #7 | Exceptional 10.1% |
| Maltese | 99.9 /100 | #8 | Exceptional 10.2% |
| Immigrants | South Central Asia | 99.9 /100 | #9 | Exceptional 10.2% |
| Bulgarians | 99.9 /100 | #10 | Exceptional 10.2% |
| Immigrants | Lithuania | 99.9 /100 | #11 | Exceptional 10.3% |
| Bhutanese | 99.8 /100 | #12 | Exceptional 10.4% |
| Immigrants | Hong Kong | 99.8 /100 | #13 | Exceptional 10.4% |
| Immigrants | Bolivia | 99.8 /100 | #14 | Exceptional 10.4% |
| Bolivians | 99.8 /100 | #15 | Exceptional 10.4% |
| Lithuanians | 99.8 /100 | #16 | Exceptional 10.5% |
| Norwegians | 99.8 /100 | #17 | Exceptional 10.5% |
| Latvians | 99.8 /100 | #18 | Exceptional 10.5% |