Iroquois vs Guyanese Female Poverty Among 25-34 Year Olds
COMPARE
Iroquois
Guyanese
Female Poverty Among 25-34 Year Olds
Female Poverty Among 25-34 Year Olds Comparison
Iroquois
Guyanese
17.5%
FEMALE POVERTY AMONG 25-34 YEAR OLDS
0.0/ 100
METRIC RATING
312th/ 347
METRIC RANK
14.2%
FEMALE POVERTY AMONG 25-34 YEAR OLDS
8.6/ 100
METRIC RATING
209th/ 347
METRIC RANK
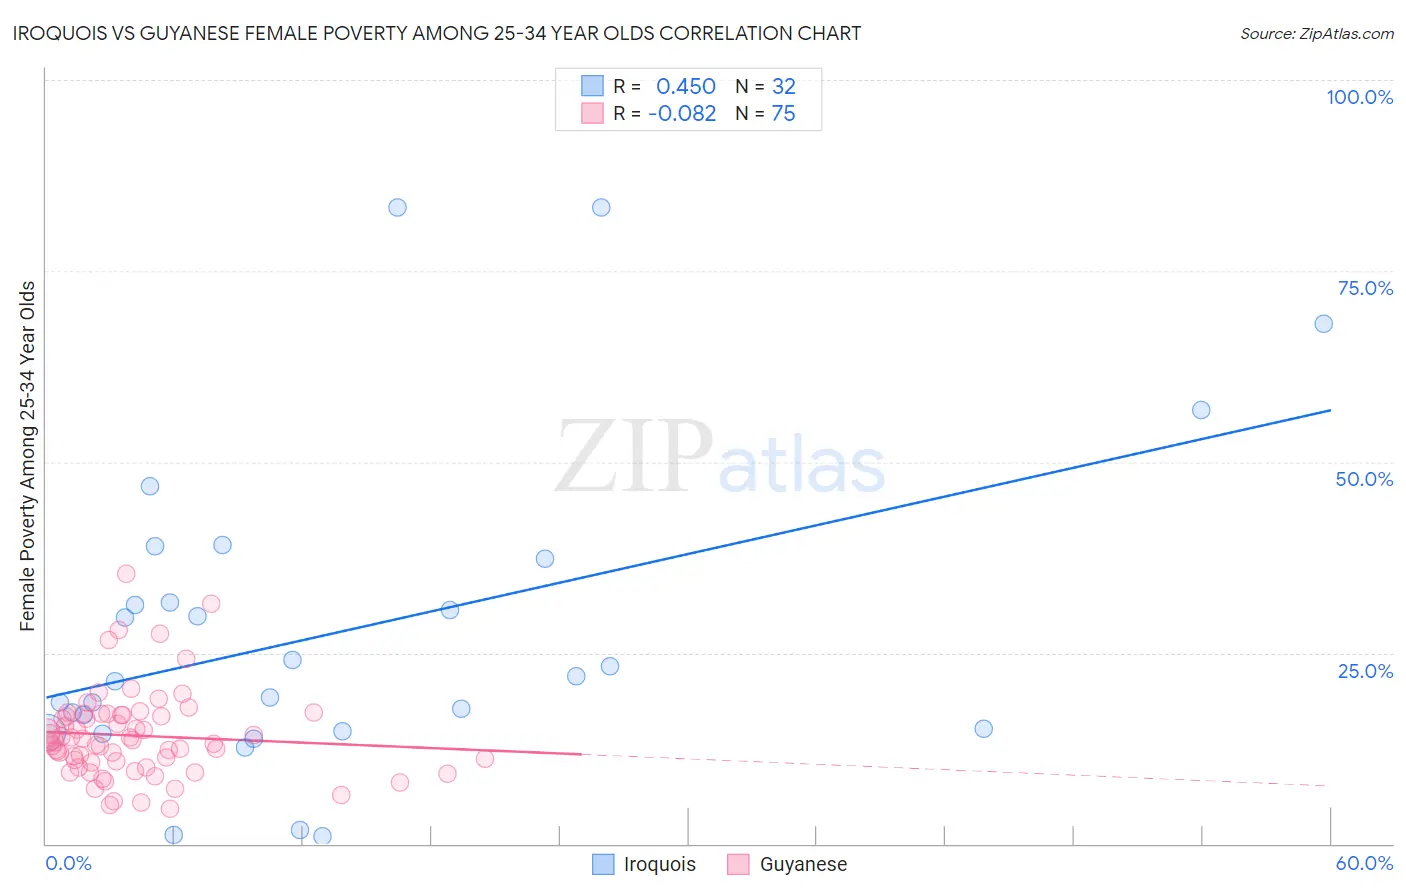
Iroquois vs Guyanese Female Poverty Among 25-34 Year Olds Correlation Chart
The statistical analysis conducted on geographies consisting of 205,419,600 people shows a moderate positive correlation between the proportion of Iroquois and poverty level among females between the ages 25 and 34 in the United States with a correlation coefficient (R) of 0.450 and weighted average of 17.5%. Similarly, the statistical analysis conducted on geographies consisting of 175,220,528 people shows a slight negative correlation between the proportion of Guyanese and poverty level among females between the ages 25 and 34 in the United States with a correlation coefficient (R) of -0.082 and weighted average of 14.2%, a difference of 23.0%.
Female Poverty Among 25-34 Year Olds Correlation Summary
| Measurement | Iroquois | Guyanese |
| Minimum | 0.99% | 4.6% |
| Maximum | 83.3% | 35.3% |
| Range | 82.3% | 30.7% |
| Mean | 27.9% | 14.2% |
| Median | 21.5% | 13.4% |
| Interquartile 25% (IQ1) | 14.8% | 10.7% |
| Interquartile 75% (IQ3) | 34.5% | 16.8% |
| Interquartile Range (IQR) | 19.6% | 6.2% |
| Standard Deviation (Sample) | 20.7% | 5.8% |
| Standard Deviation (Population) | 20.4% | 5.8% |
Similar Demographics by Female Poverty Among 25-34 Year Olds
Demographics Similar to Iroquois by Female Poverty Among 25-34 Year Olds
In terms of female poverty among 25-34 year olds, the demographic groups most similar to Iroquois are Colville (17.5%, a difference of 0.080%), Immigrants from Dominican Republic (17.6%, a difference of 0.76%), Yakama (17.6%, a difference of 0.98%), Dominican (17.6%, a difference of 0.98%), and Immigrants from Honduras (17.3%, a difference of 1.1%).
| Demographics | Rating | Rank | Female Poverty Among 25-34 Year Olds |
| Immigrants | Cabo Verde | 0.0 /100 | #305 | Tragic 16.9% |
| Chickasaw | 0.0 /100 | #306 | Tragic 17.0% |
| Yaqui | 0.0 /100 | #307 | Tragic 17.0% |
| Africans | 0.0 /100 | #308 | Tragic 17.0% |
| Ottawa | 0.0 /100 | #309 | Tragic 17.1% |
| Cherokee | 0.0 /100 | #310 | Tragic 17.2% |
| Immigrants | Honduras | 0.0 /100 | #311 | Tragic 17.3% |
| Iroquois | 0.0 /100 | #312 | Tragic 17.5% |
| Colville | 0.0 /100 | #313 | Tragic 17.5% |
| Immigrants | Dominican Republic | 0.0 /100 | #314 | Tragic 17.6% |
| Yakama | 0.0 /100 | #315 | Tragic 17.6% |
| Dominicans | 0.0 /100 | #316 | Tragic 17.6% |
| Arapaho | 0.0 /100 | #317 | Tragic 17.8% |
| Ute | 0.0 /100 | #318 | Tragic 17.9% |
| Menominee | 0.0 /100 | #319 | Tragic 18.0% |
Demographics Similar to Guyanese by Female Poverty Among 25-34 Year Olds
In terms of female poverty among 25-34 year olds, the demographic groups most similar to Guyanese are Panamanian (14.2%, a difference of 0.010%), Trinidadian and Tobagonian (14.2%, a difference of 0.12%), Immigrants from Guyana (14.3%, a difference of 0.57%), Puget Sound Salish (14.3%, a difference of 0.60%), and Immigrants from Panama (14.1%, a difference of 0.66%).
| Demographics | Rating | Rank | Female Poverty Among 25-34 Year Olds |
| Welsh | 17.2 /100 | #202 | Poor 14.0% |
| Immigrants | Immigrants | 14.5 /100 | #203 | Poor 14.0% |
| Hawaiians | 13.6 /100 | #204 | Poor 14.1% |
| Immigrants | Africa | 13.4 /100 | #205 | Poor 14.1% |
| Hungarians | 11.8 /100 | #206 | Poor 14.1% |
| Japanese | 11.7 /100 | #207 | Poor 14.1% |
| Immigrants | Panama | 11.6 /100 | #208 | Poor 14.1% |
| Guyanese | 8.6 /100 | #209 | Tragic 14.2% |
| Panamanians | 8.6 /100 | #210 | Tragic 14.2% |
| Trinidadians and Tobagonians | 8.2 /100 | #211 | Tragic 14.2% |
| Immigrants | Guyana | 6.6 /100 | #212 | Tragic 14.3% |
| Puget Sound Salish | 6.5 /100 | #213 | Tragic 14.3% |
| French | 6.2 /100 | #214 | Tragic 14.3% |
| Immigrants | Nigeria | 6.2 /100 | #215 | Tragic 14.3% |
| French Canadians | 5.5 /100 | #216 | Tragic 14.3% |