Carpatho Rusyn vs Guyanese Female Poverty Among 25-34 Year Olds
COMPARE
Carpatho Rusyn
Guyanese
Female Poverty Among 25-34 Year Olds
Female Poverty Among 25-34 Year Olds Comparison
Carpatho Rusyns
Guyanese
12.8%
FEMALE POVERTY AMONG 25-34 YEAR OLDS
93.0/ 100
METRIC RATING
120th/ 347
METRIC RANK
14.2%
FEMALE POVERTY AMONG 25-34 YEAR OLDS
8.6/ 100
METRIC RATING
209th/ 347
METRIC RANK
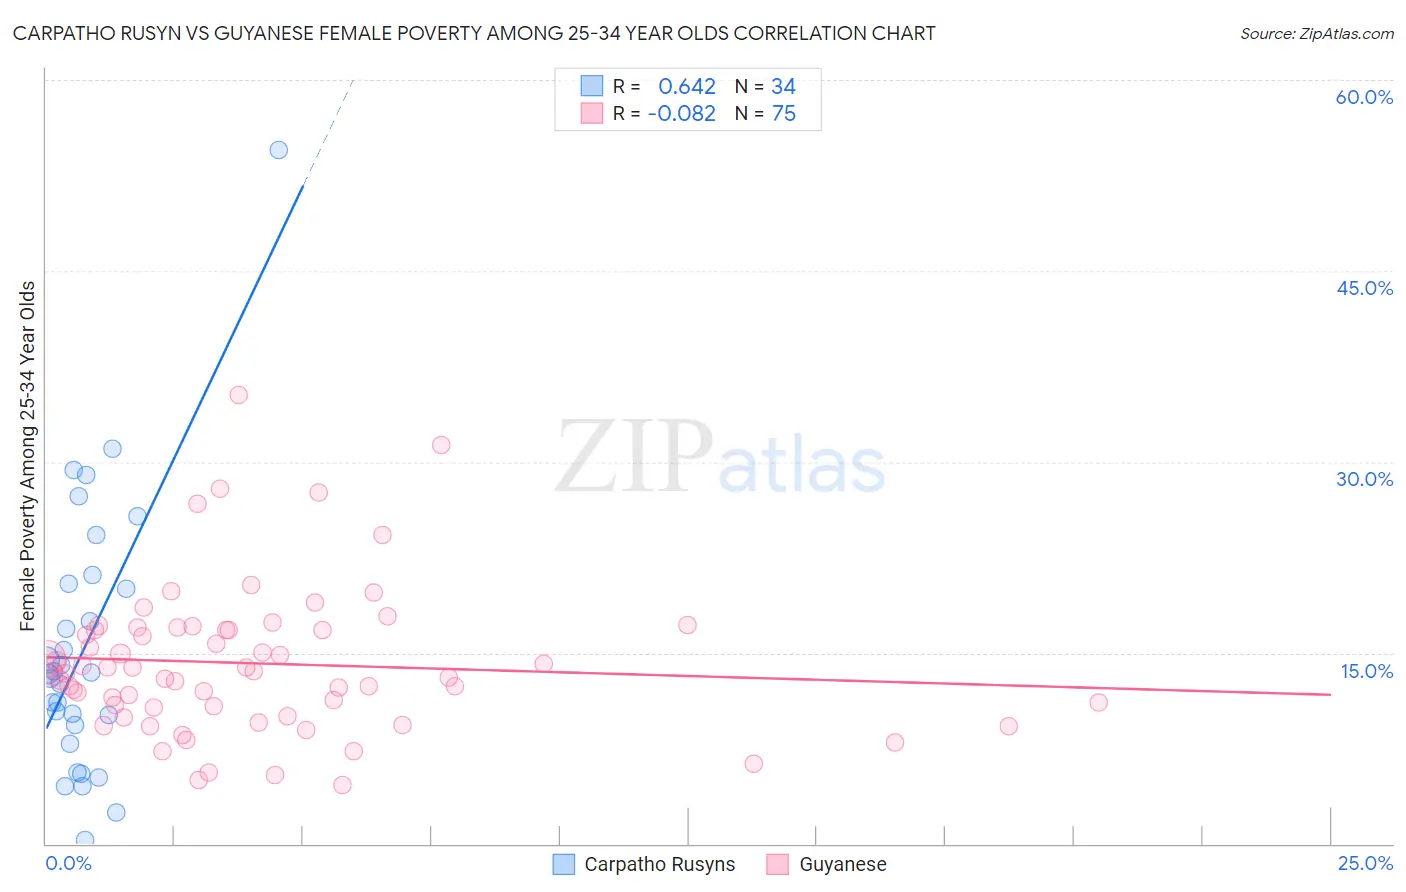
Carpatho Rusyn vs Guyanese Female Poverty Among 25-34 Year Olds Correlation Chart
The statistical analysis conducted on geographies consisting of 58,469,179 people shows a significant positive correlation between the proportion of Carpatho Rusyns and poverty level among females between the ages 25 and 34 in the United States with a correlation coefficient (R) of 0.642 and weighted average of 12.8%. Similarly, the statistical analysis conducted on geographies consisting of 175,220,528 people shows a slight negative correlation between the proportion of Guyanese and poverty level among females between the ages 25 and 34 in the United States with a correlation coefficient (R) of -0.082 and weighted average of 14.2%, a difference of 10.9%.
Female Poverty Among 25-34 Year Olds Correlation Summary
| Measurement | Carpatho Rusyn | Guyanese |
| Minimum | 0.28% | 4.6% |
| Maximum | 54.5% | 35.3% |
| Range | 54.3% | 30.7% |
| Mean | 15.4% | 14.2% |
| Median | 13.4% | 13.4% |
| Interquartile 25% (IQ1) | 9.3% | 10.7% |
| Interquartile 75% (IQ3) | 20.4% | 16.8% |
| Interquartile Range (IQR) | 11.1% | 6.2% |
| Standard Deviation (Sample) | 10.6% | 5.8% |
| Standard Deviation (Population) | 10.5% | 5.8% |
Similar Demographics by Female Poverty Among 25-34 Year Olds
Demographics Similar to Carpatho Rusyns by Female Poverty Among 25-34 Year Olds
In terms of female poverty among 25-34 year olds, the demographic groups most similar to Carpatho Rusyns are Immigrants from Nepal (12.8%, a difference of 0.0%), Mongolian (12.8%, a difference of 0.010%), Immigrants from Kuwait (12.8%, a difference of 0.030%), Romanian (12.8%, a difference of 0.070%), and Immigrants from Western Asia (12.8%, a difference of 0.080%).
| Demographics | Rating | Rank | Female Poverty Among 25-34 Year Olds |
| Immigrants | Syria | 93.8 /100 | #113 | Exceptional 12.8% |
| Immigrants | Southern Europe | 93.6 /100 | #114 | Exceptional 12.8% |
| Immigrants | Brazil | 93.3 /100 | #115 | Exceptional 12.8% |
| Chileans | 93.2 /100 | #116 | Exceptional 12.8% |
| Immigrants | Kuwait | 93.1 /100 | #117 | Exceptional 12.8% |
| Mongolians | 93.0 /100 | #118 | Exceptional 12.8% |
| Immigrants | Nepal | 93.0 /100 | #119 | Exceptional 12.8% |
| Carpatho Rusyns | 93.0 /100 | #120 | Exceptional 12.8% |
| Romanians | 92.8 /100 | #121 | Exceptional 12.8% |
| Immigrants | Western Asia | 92.7 /100 | #122 | Exceptional 12.8% |
| Slovenes | 92.7 /100 | #123 | Exceptional 12.8% |
| Immigrants | Netherlands | 92.0 /100 | #124 | Exceptional 12.8% |
| Immigrants | Canada | 91.5 /100 | #125 | Exceptional 12.9% |
| Immigrants | Fiji | 91.2 /100 | #126 | Exceptional 12.9% |
| Czechs | 90.3 /100 | #127 | Exceptional 12.9% |
Demographics Similar to Guyanese by Female Poverty Among 25-34 Year Olds
In terms of female poverty among 25-34 year olds, the demographic groups most similar to Guyanese are Panamanian (14.2%, a difference of 0.010%), Trinidadian and Tobagonian (14.2%, a difference of 0.12%), Immigrants from Guyana (14.3%, a difference of 0.57%), Puget Sound Salish (14.3%, a difference of 0.60%), and Immigrants from Panama (14.1%, a difference of 0.66%).
| Demographics | Rating | Rank | Female Poverty Among 25-34 Year Olds |
| Welsh | 17.2 /100 | #202 | Poor 14.0% |
| Immigrants | Immigrants | 14.5 /100 | #203 | Poor 14.0% |
| Hawaiians | 13.6 /100 | #204 | Poor 14.1% |
| Immigrants | Africa | 13.4 /100 | #205 | Poor 14.1% |
| Hungarians | 11.8 /100 | #206 | Poor 14.1% |
| Japanese | 11.7 /100 | #207 | Poor 14.1% |
| Immigrants | Panama | 11.6 /100 | #208 | Poor 14.1% |
| Guyanese | 8.6 /100 | #209 | Tragic 14.2% |
| Panamanians | 8.6 /100 | #210 | Tragic 14.2% |
| Trinidadians and Tobagonians | 8.2 /100 | #211 | Tragic 14.2% |
| Immigrants | Guyana | 6.6 /100 | #212 | Tragic 14.3% |
| Puget Sound Salish | 6.5 /100 | #213 | Tragic 14.3% |
| French | 6.2 /100 | #214 | Tragic 14.3% |
| Immigrants | Nigeria | 6.2 /100 | #215 | Tragic 14.3% |
| French Canadians | 5.5 /100 | #216 | Tragic 14.3% |