Iroquois vs Guyanese Median Family Income
COMPARE
Iroquois
Guyanese
Median Family Income
Median Family Income Comparison
Iroquois
Guyanese
$90,543
MEDIAN FAMILY INCOME
0.2/ 100
METRIC RATING
271st/ 347
METRIC RANK
$93,373
MEDIAN FAMILY INCOME
0.9/ 100
METRIC RATING
246th/ 347
METRIC RANK
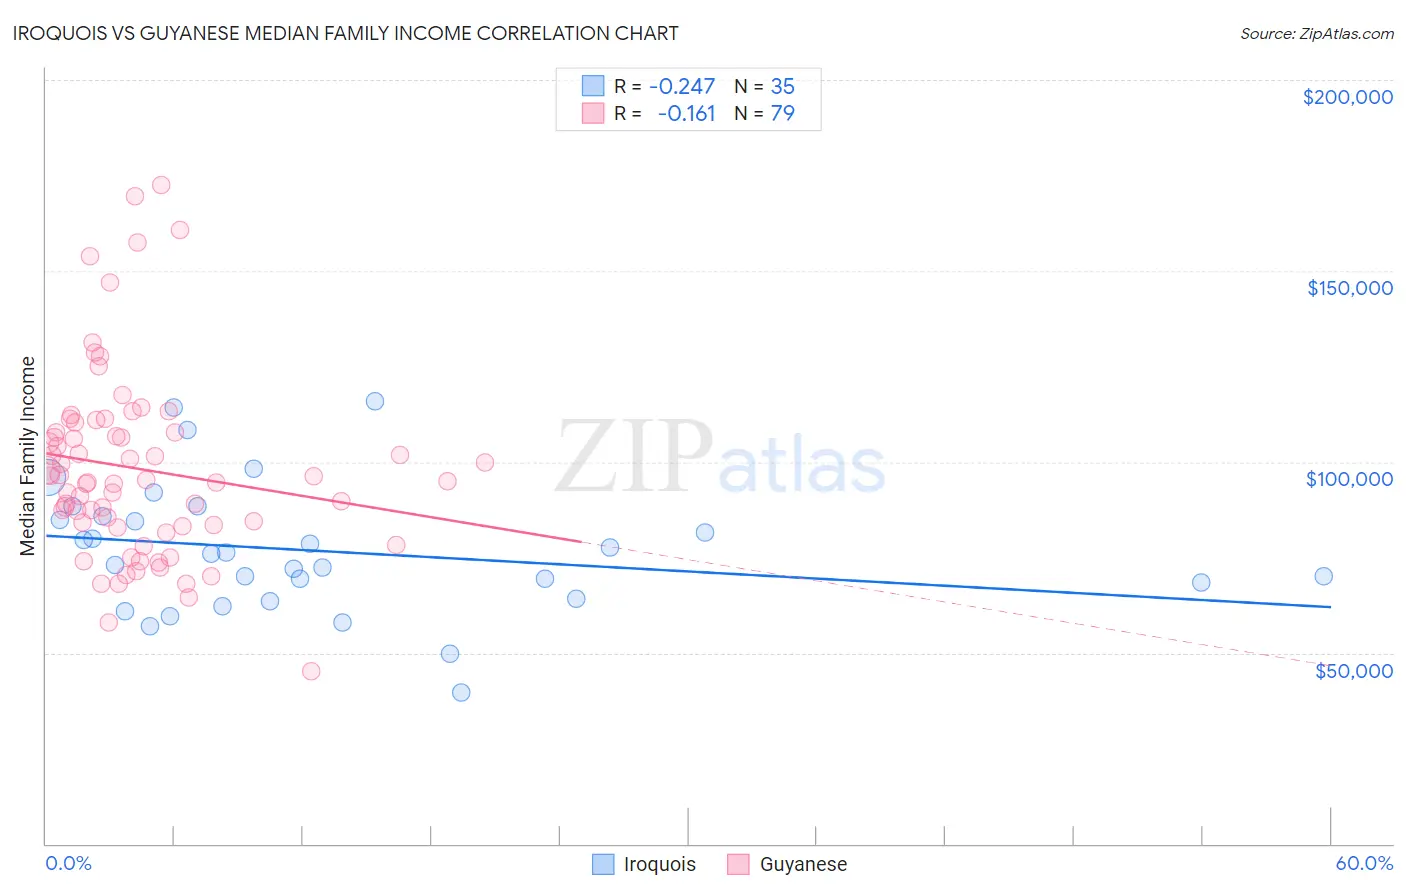
Iroquois vs Guyanese Median Family Income Correlation Chart
The statistical analysis conducted on geographies consisting of 207,203,022 people shows a weak negative correlation between the proportion of Iroquois and median family income in the United States with a correlation coefficient (R) of -0.247 and weighted average of $90,543. Similarly, the statistical analysis conducted on geographies consisting of 176,743,960 people shows a poor negative correlation between the proportion of Guyanese and median family income in the United States with a correlation coefficient (R) of -0.161 and weighted average of $93,373, a difference of 3.1%.
Median Family Income Correlation Summary
| Measurement | Iroquois | Guyanese |
| Minimum | $39,479 | $45,100 |
| Maximum | $115,891 | $172,597 |
| Range | $76,412 | $127,497 |
| Mean | $76,689 | $98,114 |
| Median | $75,795 | $94,843 |
| Interquartile 25% (IQ1) | $64,141 | $83,119 |
| Interquartile 75% (IQ3) | $85,646 | $107,693 |
| Interquartile Range (IQR) | $21,505 | $24,574 |
| Standard Deviation (Sample) | $16,973 | $24,573 |
| Standard Deviation (Population) | $16,729 | $24,417 |
Similar Demographics by Median Family Income
Demographics Similar to Iroquois by Median Family Income
In terms of median family income, the demographic groups most similar to Iroquois are Jamaican ($90,581, a difference of 0.040%), Immigrants from Liberia ($90,450, a difference of 0.10%), Immigrants from Micronesia ($90,345, a difference of 0.22%), Spanish American ($90,322, a difference of 0.24%), and Cree ($90,882, a difference of 0.37%).
| Demographics | Rating | Rank | Median Family Income |
| Senegalese | 0.3 /100 | #264 | Tragic $91,475 |
| Hmong | 0.3 /100 | #265 | Tragic $91,296 |
| Central Americans | 0.3 /100 | #266 | Tragic $91,087 |
| Mexican American Indians | 0.2 /100 | #267 | Tragic $90,918 |
| Cree | 0.2 /100 | #268 | Tragic $90,882 |
| Belizeans | 0.2 /100 | #269 | Tragic $90,880 |
| Jamaicans | 0.2 /100 | #270 | Tragic $90,581 |
| Iroquois | 0.2 /100 | #271 | Tragic $90,543 |
| Immigrants | Liberia | 0.2 /100 | #272 | Tragic $90,450 |
| Immigrants | Micronesia | 0.2 /100 | #273 | Tragic $90,345 |
| Spanish Americans | 0.2 /100 | #274 | Tragic $90,322 |
| Immigrants | St. Vincent and the Grenadines | 0.2 /100 | #275 | Tragic $90,094 |
| Immigrants | Zaire | 0.1 /100 | #276 | Tragic $89,285 |
| Immigrants | Jamaica | 0.1 /100 | #277 | Tragic $89,268 |
| Immigrants | Grenada | 0.1 /100 | #278 | Tragic $89,249 |
Demographics Similar to Guyanese by Median Family Income
In terms of median family income, the demographic groups most similar to Guyanese are Immigrants from Middle Africa ($93,593, a difference of 0.23%), Subsaharan African ($93,748, a difference of 0.40%), Immigrants from Senegal ($92,912, a difference of 0.50%), German Russian ($93,858, a difference of 0.52%), and French American Indian ($92,872, a difference of 0.54%).
| Demographics | Rating | Rank | Median Family Income |
| Salvadorans | 1.2 /100 | #239 | Tragic $94,109 |
| Somalis | 1.2 /100 | #240 | Tragic $94,085 |
| Immigrants | Trinidad and Tobago | 1.2 /100 | #241 | Tragic $93,988 |
| Barbadians | 1.1 /100 | #242 | Tragic $93,919 |
| German Russians | 1.1 /100 | #243 | Tragic $93,858 |
| Sub-Saharan Africans | 1.0 /100 | #244 | Tragic $93,748 |
| Immigrants | Middle Africa | 1.0 /100 | #245 | Tragic $93,593 |
| Guyanese | 0.9 /100 | #246 | Tragic $93,373 |
| Immigrants | Senegal | 0.7 /100 | #247 | Tragic $92,912 |
| French American Indians | 0.7 /100 | #248 | Tragic $92,872 |
| Immigrants | Ecuador | 0.7 /100 | #249 | Tragic $92,837 |
| West Indians | 0.6 /100 | #250 | Tragic $92,765 |
| Immigrants | Somalia | 0.6 /100 | #251 | Tragic $92,609 |
| Immigrants | El Salvador | 0.6 /100 | #252 | Tragic $92,545 |
| Immigrants | Guyana | 0.6 /100 | #253 | Tragic $92,513 |