Iroquois vs Czech Female Poverty Among 25-34 Year Olds
COMPARE
Iroquois
Czech
Female Poverty Among 25-34 Year Olds
Female Poverty Among 25-34 Year Olds Comparison
Iroquois
Czechs
17.5%
FEMALE POVERTY AMONG 25-34 YEAR OLDS
0.0/ 100
METRIC RATING
312th/ 347
METRIC RANK
12.9%
FEMALE POVERTY AMONG 25-34 YEAR OLDS
90.3/ 100
METRIC RATING
127th/ 347
METRIC RANK
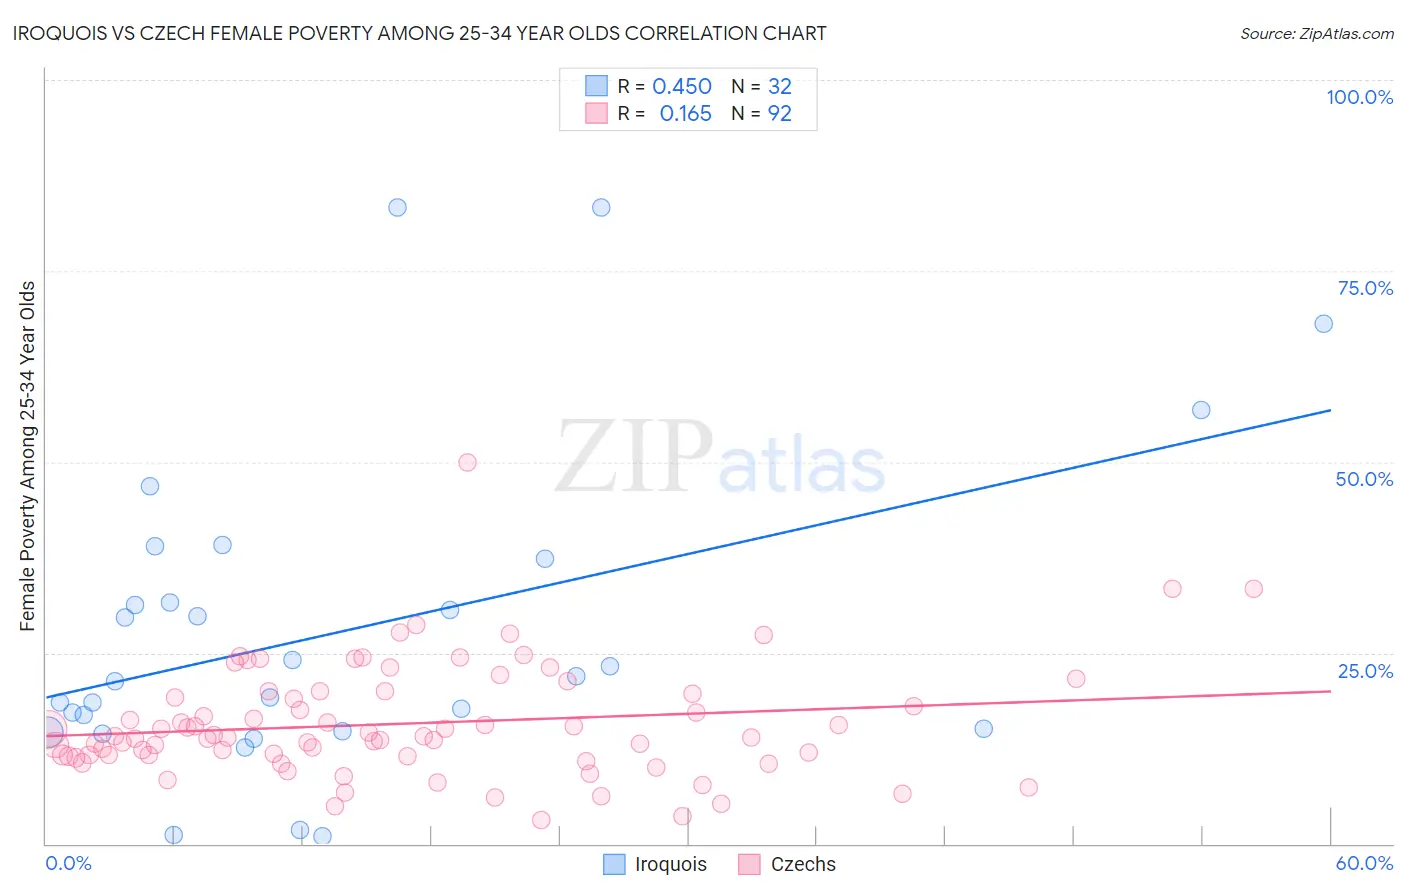
Iroquois vs Czech Female Poverty Among 25-34 Year Olds Correlation Chart
The statistical analysis conducted on geographies consisting of 205,419,600 people shows a moderate positive correlation between the proportion of Iroquois and poverty level among females between the ages 25 and 34 in the United States with a correlation coefficient (R) of 0.450 and weighted average of 17.5%. Similarly, the statistical analysis conducted on geographies consisting of 470,997,416 people shows a poor positive correlation between the proportion of Czechs and poverty level among females between the ages 25 and 34 in the United States with a correlation coefficient (R) of 0.165 and weighted average of 12.9%, a difference of 35.3%.
Female Poverty Among 25-34 Year Olds Correlation Summary
| Measurement | Iroquois | Czech |
| Minimum | 0.99% | 3.0% |
| Maximum | 83.3% | 50.0% |
| Range | 82.3% | 47.0% |
| Mean | 27.9% | 15.7% |
| Median | 21.5% | 14.0% |
| Interquartile 25% (IQ1) | 14.8% | 11.6% |
| Interquartile 75% (IQ3) | 34.5% | 19.8% |
| Interquartile Range (IQR) | 19.6% | 8.3% |
| Standard Deviation (Sample) | 20.7% | 7.4% |
| Standard Deviation (Population) | 20.4% | 7.3% |
Similar Demographics by Female Poverty Among 25-34 Year Olds
Demographics Similar to Iroquois by Female Poverty Among 25-34 Year Olds
In terms of female poverty among 25-34 year olds, the demographic groups most similar to Iroquois are Colville (17.5%, a difference of 0.080%), Immigrants from Dominican Republic (17.6%, a difference of 0.76%), Yakama (17.6%, a difference of 0.98%), Dominican (17.6%, a difference of 0.98%), and Immigrants from Honduras (17.3%, a difference of 1.1%).
| Demographics | Rating | Rank | Female Poverty Among 25-34 Year Olds |
| Immigrants | Cabo Verde | 0.0 /100 | #305 | Tragic 16.9% |
| Chickasaw | 0.0 /100 | #306 | Tragic 17.0% |
| Yaqui | 0.0 /100 | #307 | Tragic 17.0% |
| Africans | 0.0 /100 | #308 | Tragic 17.0% |
| Ottawa | 0.0 /100 | #309 | Tragic 17.1% |
| Cherokee | 0.0 /100 | #310 | Tragic 17.2% |
| Immigrants | Honduras | 0.0 /100 | #311 | Tragic 17.3% |
| Iroquois | 0.0 /100 | #312 | Tragic 17.5% |
| Colville | 0.0 /100 | #313 | Tragic 17.5% |
| Immigrants | Dominican Republic | 0.0 /100 | #314 | Tragic 17.6% |
| Yakama | 0.0 /100 | #315 | Tragic 17.6% |
| Dominicans | 0.0 /100 | #316 | Tragic 17.6% |
| Arapaho | 0.0 /100 | #317 | Tragic 17.8% |
| Ute | 0.0 /100 | #318 | Tragic 17.9% |
| Menominee | 0.0 /100 | #319 | Tragic 18.0% |
Demographics Similar to Czechs by Female Poverty Among 25-34 Year Olds
In terms of female poverty among 25-34 year olds, the demographic groups most similar to Czechs are Syrian (12.9%, a difference of 0.020%), Immigrants from North America (12.9%, a difference of 0.13%), Immigrants from Uzbekistan (12.9%, a difference of 0.16%), Immigrants from Fiji (12.9%, a difference of 0.23%), and Immigrants from Canada (12.9%, a difference of 0.32%).
| Demographics | Rating | Rank | Female Poverty Among 25-34 Year Olds |
| Carpatho Rusyns | 93.0 /100 | #120 | Exceptional 12.8% |
| Romanians | 92.8 /100 | #121 | Exceptional 12.8% |
| Immigrants | Western Asia | 92.7 /100 | #122 | Exceptional 12.8% |
| Slovenes | 92.7 /100 | #123 | Exceptional 12.8% |
| Immigrants | Netherlands | 92.0 /100 | #124 | Exceptional 12.8% |
| Immigrants | Canada | 91.5 /100 | #125 | Exceptional 12.9% |
| Immigrants | Fiji | 91.2 /100 | #126 | Exceptional 12.9% |
| Czechs | 90.3 /100 | #127 | Exceptional 12.9% |
| Syrians | 90.2 /100 | #128 | Exceptional 12.9% |
| Immigrants | North America | 89.7 /100 | #129 | Excellent 12.9% |
| Immigrants | Uzbekistan | 89.6 /100 | #130 | Excellent 12.9% |
| Pakistanis | 88.4 /100 | #131 | Excellent 13.0% |
| Immigrants | Hungary | 88.3 /100 | #132 | Excellent 13.0% |
| Serbians | 87.6 /100 | #133 | Excellent 13.0% |
| Afghans | 85.8 /100 | #134 | Excellent 13.0% |