Vietnamese vs Guyanese Female Poverty Among 25-34 Year Olds
COMPARE
Vietnamese
Guyanese
Female Poverty Among 25-34 Year Olds
Female Poverty Among 25-34 Year Olds Comparison
Vietnamese
Guyanese
14.6%
FEMALE POVERTY AMONG 25-34 YEAR OLDS
2.6/ 100
METRIC RATING
228th/ 347
METRIC RANK
14.2%
FEMALE POVERTY AMONG 25-34 YEAR OLDS
8.6/ 100
METRIC RATING
209th/ 347
METRIC RANK
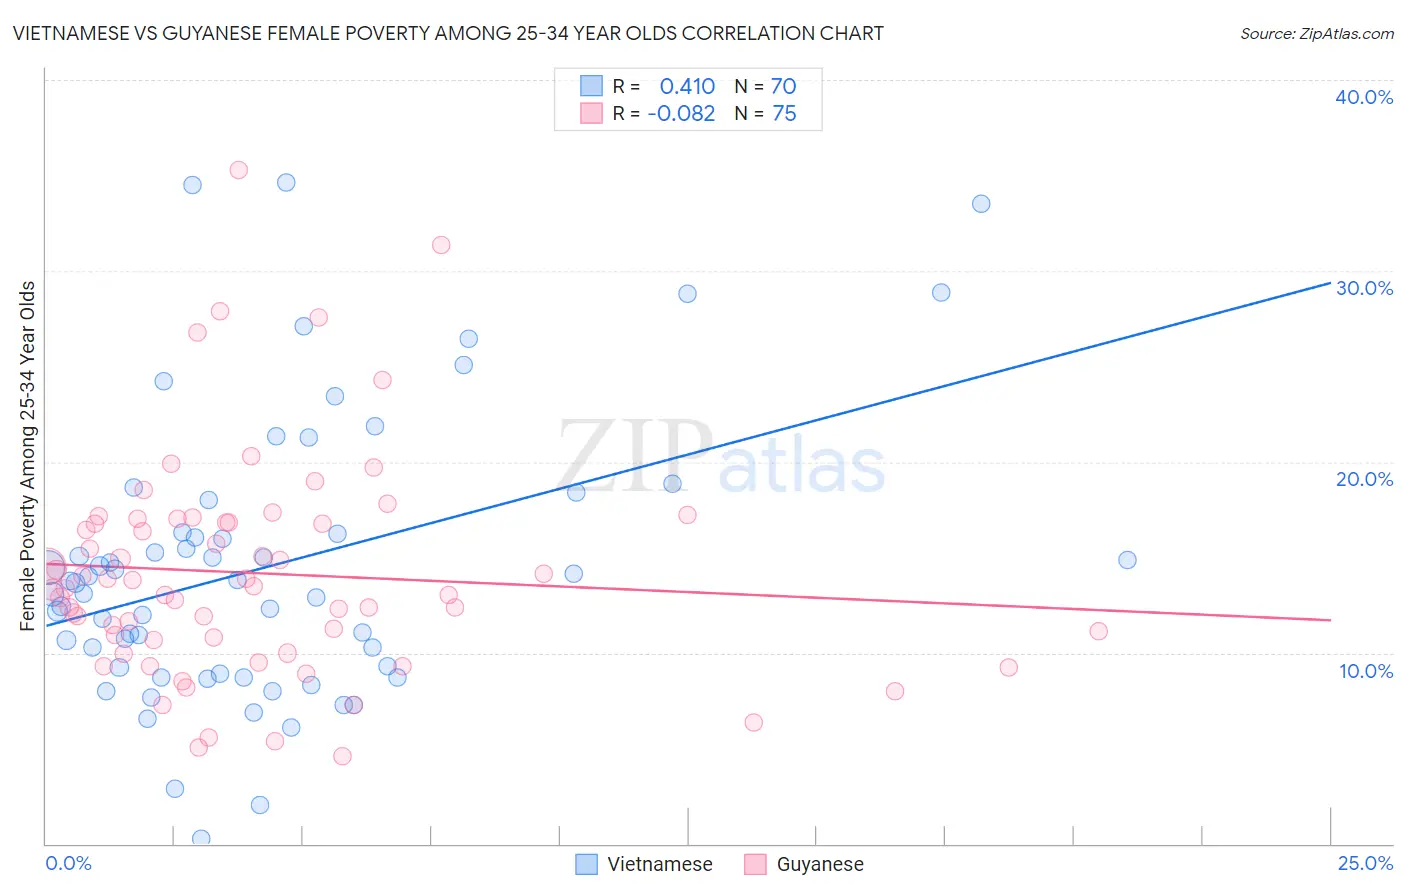
Vietnamese vs Guyanese Female Poverty Among 25-34 Year Olds Correlation Chart
The statistical analysis conducted on geographies consisting of 169,660,350 people shows a moderate positive correlation between the proportion of Vietnamese and poverty level among females between the ages 25 and 34 in the United States with a correlation coefficient (R) of 0.410 and weighted average of 14.6%. Similarly, the statistical analysis conducted on geographies consisting of 175,220,528 people shows a slight negative correlation between the proportion of Guyanese and poverty level among females between the ages 25 and 34 in the United States with a correlation coefficient (R) of -0.082 and weighted average of 14.2%, a difference of 2.5%.
Female Poverty Among 25-34 Year Olds Correlation Summary
| Measurement | Vietnamese | Guyanese |
| Minimum | 0.24% | 4.6% |
| Maximum | 34.6% | 35.3% |
| Range | 34.4% | 30.7% |
| Mean | 14.5% | 14.2% |
| Median | 13.7% | 13.4% |
| Interquartile 25% (IQ1) | 9.2% | 10.7% |
| Interquartile 75% (IQ3) | 16.3% | 16.8% |
| Interquartile Range (IQR) | 7.1% | 6.2% |
| Standard Deviation (Sample) | 7.3% | 5.8% |
| Standard Deviation (Population) | 7.3% | 5.8% |
Demographics Similar to Vietnamese and Guyanese by Female Poverty Among 25-34 Year Olds
In terms of female poverty among 25-34 year olds, the demographic groups most similar to Vietnamese are Celtic (14.5%, a difference of 0.17%), Nicaraguan (14.5%, a difference of 0.47%), Immigrants from Barbados (14.5%, a difference of 0.55%), Immigrants from Sudan (14.4%, a difference of 0.88%), and Nigerian (14.4%, a difference of 0.95%). Similarly, the demographic groups most similar to Guyanese are Panamanian (14.2%, a difference of 0.010%), Trinidadian and Tobagonian (14.2%, a difference of 0.12%), Immigrants from Guyana (14.3%, a difference of 0.57%), Puget Sound Salish (14.3%, a difference of 0.60%), and Immigrants from Panama (14.1%, a difference of 0.66%).
| Demographics | Rating | Rank | Female Poverty Among 25-34 Year Olds |
| Immigrants | Panama | 11.6 /100 | #208 | Poor 14.1% |
| Guyanese | 8.6 /100 | #209 | Tragic 14.2% |
| Panamanians | 8.6 /100 | #210 | Tragic 14.2% |
| Trinidadians and Tobagonians | 8.2 /100 | #211 | Tragic 14.2% |
| Immigrants | Guyana | 6.6 /100 | #212 | Tragic 14.3% |
| Puget Sound Salish | 6.5 /100 | #213 | Tragic 14.3% |
| French | 6.2 /100 | #214 | Tragic 14.3% |
| Immigrants | Nigeria | 6.2 /100 | #215 | Tragic 14.3% |
| French Canadians | 5.5 /100 | #216 | Tragic 14.3% |
| Spanish American Indians | 5.5 /100 | #217 | Tragic 14.3% |
| Immigrants | Thailand | 5.2 /100 | #218 | Tragic 14.3% |
| Ecuadorians | 5.2 /100 | #219 | Tragic 14.3% |
| Ghanaians | 4.8 /100 | #220 | Tragic 14.4% |
| Sudanese | 4.4 /100 | #221 | Tragic 14.4% |
| Immigrants | Portugal | 4.3 /100 | #222 | Tragic 14.4% |
| Nigerians | 4.2 /100 | #223 | Tragic 14.4% |
| Immigrants | Sudan | 4.0 /100 | #224 | Tragic 14.4% |
| Immigrants | Barbados | 3.4 /100 | #225 | Tragic 14.5% |
| Nicaraguans | 3.3 /100 | #226 | Tragic 14.5% |
| Celtics | 2.8 /100 | #227 | Tragic 14.5% |
| Vietnamese | 2.6 /100 | #228 | Tragic 14.6% |