Basque vs Guyanese Female Poverty Among 25-34 Year Olds
COMPARE
Basque
Guyanese
Female Poverty Among 25-34 Year Olds
Female Poverty Among 25-34 Year Olds Comparison
Basques
Guyanese
13.4%
FEMALE POVERTY AMONG 25-34 YEAR OLDS
59.3/ 100
METRIC RATING
165th/ 347
METRIC RANK
14.2%
FEMALE POVERTY AMONG 25-34 YEAR OLDS
8.6/ 100
METRIC RATING
209th/ 347
METRIC RANK
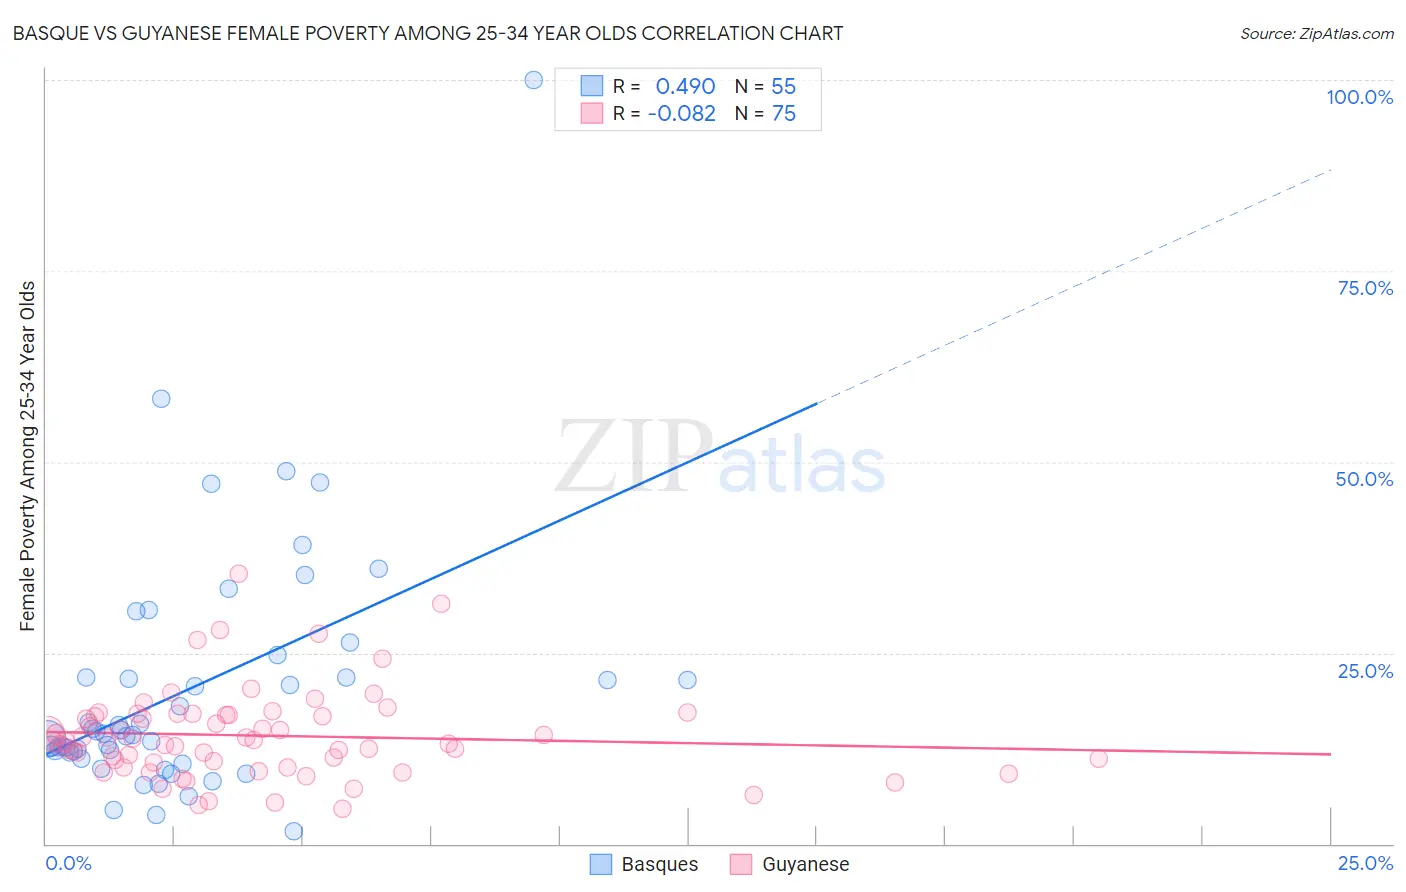
Basque vs Guyanese Female Poverty Among 25-34 Year Olds Correlation Chart
The statistical analysis conducted on geographies consisting of 164,712,291 people shows a moderate positive correlation between the proportion of Basques and poverty level among females between the ages 25 and 34 in the United States with a correlation coefficient (R) of 0.490 and weighted average of 13.4%. Similarly, the statistical analysis conducted on geographies consisting of 175,220,528 people shows a slight negative correlation between the proportion of Guyanese and poverty level among females between the ages 25 and 34 in the United States with a correlation coefficient (R) of -0.082 and weighted average of 14.2%, a difference of 5.7%.
Female Poverty Among 25-34 Year Olds Correlation Summary
| Measurement | Basque | Guyanese |
| Minimum | 1.7% | 4.6% |
| Maximum | 100.0% | 35.3% |
| Range | 98.3% | 30.7% |
| Mean | 20.2% | 14.2% |
| Median | 14.4% | 13.4% |
| Interquartile 25% (IQ1) | 12.0% | 10.7% |
| Interquartile 75% (IQ3) | 21.7% | 16.8% |
| Interquartile Range (IQR) | 9.8% | 6.2% |
| Standard Deviation (Sample) | 16.4% | 5.8% |
| Standard Deviation (Population) | 16.2% | 5.8% |
Similar Demographics by Female Poverty Among 25-34 Year Olds
Demographics Similar to Basques by Female Poverty Among 25-34 Year Olds
In terms of female poverty among 25-34 year olds, the demographic groups most similar to Basques are Belgian (13.4%, a difference of 0.030%), Immigrants from Bosnia and Herzegovina (13.4%, a difference of 0.060%), Immigrants from Afghanistan (13.4%, a difference of 0.14%), Swiss (13.4%, a difference of 0.21%), and Samoan (13.5%, a difference of 0.21%).
| Demographics | Rating | Rank | Female Poverty Among 25-34 Year Olds |
| Immigrants | Colombia | 69.2 /100 | #158 | Good 13.3% |
| Uruguayans | 66.9 /100 | #159 | Good 13.3% |
| Immigrants | South America | 66.3 /100 | #160 | Good 13.3% |
| Icelanders | 65.7 /100 | #161 | Good 13.3% |
| Ugandans | 64.1 /100 | #162 | Good 13.4% |
| British | 63.5 /100 | #163 | Good 13.4% |
| Swiss | 61.7 /100 | #164 | Good 13.4% |
| Basques | 59.3 /100 | #165 | Average 13.4% |
| Belgians | 58.9 /100 | #166 | Average 13.4% |
| Immigrants | Bosnia and Herzegovina | 58.6 /100 | #167 | Average 13.4% |
| Immigrants | Afghanistan | 57.7 /100 | #168 | Average 13.4% |
| Samoans | 56.8 /100 | #169 | Average 13.5% |
| Immigrants | Uganda | 53.0 /100 | #170 | Average 13.5% |
| South American Indians | 51.9 /100 | #171 | Average 13.5% |
| Immigrants | Costa Rica | 51.9 /100 | #172 | Average 13.5% |
Demographics Similar to Guyanese by Female Poverty Among 25-34 Year Olds
In terms of female poverty among 25-34 year olds, the demographic groups most similar to Guyanese are Panamanian (14.2%, a difference of 0.010%), Trinidadian and Tobagonian (14.2%, a difference of 0.12%), Immigrants from Guyana (14.3%, a difference of 0.57%), Puget Sound Salish (14.3%, a difference of 0.60%), and Immigrants from Panama (14.1%, a difference of 0.66%).
| Demographics | Rating | Rank | Female Poverty Among 25-34 Year Olds |
| Welsh | 17.2 /100 | #202 | Poor 14.0% |
| Immigrants | Immigrants | 14.5 /100 | #203 | Poor 14.0% |
| Hawaiians | 13.6 /100 | #204 | Poor 14.1% |
| Immigrants | Africa | 13.4 /100 | #205 | Poor 14.1% |
| Hungarians | 11.8 /100 | #206 | Poor 14.1% |
| Japanese | 11.7 /100 | #207 | Poor 14.1% |
| Immigrants | Panama | 11.6 /100 | #208 | Poor 14.1% |
| Guyanese | 8.6 /100 | #209 | Tragic 14.2% |
| Panamanians | 8.6 /100 | #210 | Tragic 14.2% |
| Trinidadians and Tobagonians | 8.2 /100 | #211 | Tragic 14.2% |
| Immigrants | Guyana | 6.6 /100 | #212 | Tragic 14.3% |
| Puget Sound Salish | 6.5 /100 | #213 | Tragic 14.3% |
| French | 6.2 /100 | #214 | Tragic 14.3% |
| Immigrants | Nigeria | 6.2 /100 | #215 | Tragic 14.3% |
| French Canadians | 5.5 /100 | #216 | Tragic 14.3% |