Scottish vs Guyanese Female Poverty Among 25-34 Year Olds
COMPARE
Scottish
Guyanese
Female Poverty Among 25-34 Year Olds
Female Poverty Among 25-34 Year Olds Comparison
Scottish
Guyanese
13.9%
FEMALE POVERTY AMONG 25-34 YEAR OLDS
23.6/ 100
METRIC RATING
196th/ 347
METRIC RANK
14.2%
FEMALE POVERTY AMONG 25-34 YEAR OLDS
8.6/ 100
METRIC RATING
209th/ 347
METRIC RANK
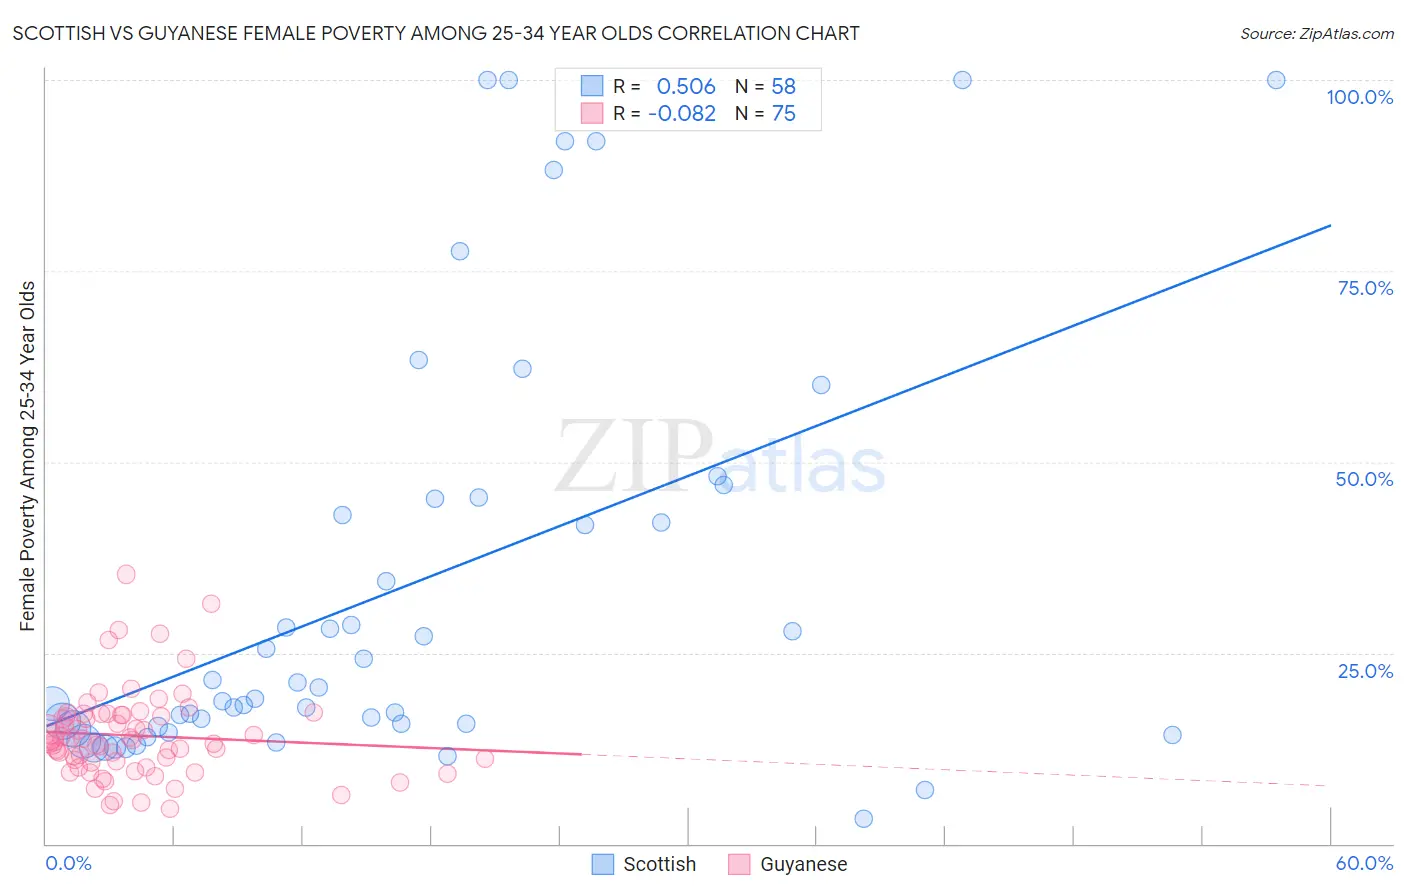
Scottish vs Guyanese Female Poverty Among 25-34 Year Olds Correlation Chart
The statistical analysis conducted on geographies consisting of 544,896,820 people shows a substantial positive correlation between the proportion of Scottish and poverty level among females between the ages 25 and 34 in the United States with a correlation coefficient (R) of 0.506 and weighted average of 13.9%. Similarly, the statistical analysis conducted on geographies consisting of 175,220,528 people shows a slight negative correlation between the proportion of Guyanese and poverty level among females between the ages 25 and 34 in the United States with a correlation coefficient (R) of -0.082 and weighted average of 14.2%, a difference of 2.4%.
Female Poverty Among 25-34 Year Olds Correlation Summary
| Measurement | Scottish | Guyanese |
| Minimum | 3.2% | 4.6% |
| Maximum | 100.0% | 35.3% |
| Range | 96.8% | 30.7% |
| Mean | 33.8% | 14.2% |
| Median | 19.7% | 13.4% |
| Interquartile 25% (IQ1) | 15.4% | 10.7% |
| Interquartile 75% (IQ3) | 45.2% | 16.8% |
| Interquartile Range (IQR) | 29.9% | 6.2% |
| Standard Deviation (Sample) | 27.8% | 5.8% |
| Standard Deviation (Population) | 27.6% | 5.8% |
Demographics Similar to Scottish and Guyanese by Female Poverty Among 25-34 Year Olds
In terms of female poverty among 25-34 year olds, the demographic groups most similar to Scottish are Immigrants from Cambodia (13.9%, a difference of 0.050%), Moroccan (13.8%, a difference of 0.16%), Immigrants from Saudi Arabia (13.9%, a difference of 0.20%), Immigrants from Germany (13.9%, a difference of 0.32%), and English (13.9%, a difference of 0.38%). Similarly, the demographic groups most similar to Guyanese are Panamanian (14.2%, a difference of 0.010%), Trinidadian and Tobagonian (14.2%, a difference of 0.12%), Immigrants from Guyana (14.3%, a difference of 0.57%), Immigrants from Panama (14.1%, a difference of 0.66%), and Japanese (14.1%, a difference of 0.68%).
| Demographics | Rating | Rank | Female Poverty Among 25-34 Year Olds |
| Tlingit-Haida | 28.1 /100 | #192 | Fair 13.8% |
| Immigrants | Kenya | 28.0 /100 | #193 | Fair 13.8% |
| Moroccans | 25.1 /100 | #194 | Fair 13.8% |
| Immigrants | Cambodia | 24.0 /100 | #195 | Fair 13.9% |
| Scottish | 23.6 /100 | #196 | Fair 13.9% |
| Immigrants | Saudi Arabia | 21.9 /100 | #197 | Fair 13.9% |
| Immigrants | Germany | 20.9 /100 | #198 | Fair 13.9% |
| English | 20.4 /100 | #199 | Fair 13.9% |
| Hmong | 20.3 /100 | #200 | Fair 13.9% |
| Immigrants | Trinidad and Tobago | 17.6 /100 | #201 | Poor 14.0% |
| Welsh | 17.2 /100 | #202 | Poor 14.0% |
| Immigrants | Immigrants | 14.5 /100 | #203 | Poor 14.0% |
| Hawaiians | 13.6 /100 | #204 | Poor 14.1% |
| Immigrants | Africa | 13.4 /100 | #205 | Poor 14.1% |
| Hungarians | 11.8 /100 | #206 | Poor 14.1% |
| Japanese | 11.7 /100 | #207 | Poor 14.1% |
| Immigrants | Panama | 11.6 /100 | #208 | Poor 14.1% |
| Guyanese | 8.6 /100 | #209 | Tragic 14.2% |
| Panamanians | 8.6 /100 | #210 | Tragic 14.2% |
| Trinidadians and Tobagonians | 8.2 /100 | #211 | Tragic 14.2% |
| Immigrants | Guyana | 6.6 /100 | #212 | Tragic 14.3% |