Alaska Native vs Chippewa Single Mother Poverty
COMPARE
Alaska Native
Chippewa
Single Mother Poverty
Single Mother Poverty Comparison
Alaska Natives
Chippewa
30.9%
SINGLE MOTHER POVERTY
0.6/ 100
METRIC RATING
252nd/ 347
METRIC RANK
34.8%
SINGLE MOTHER POVERTY
0.0/ 100
METRIC RATING
319th/ 347
METRIC RANK
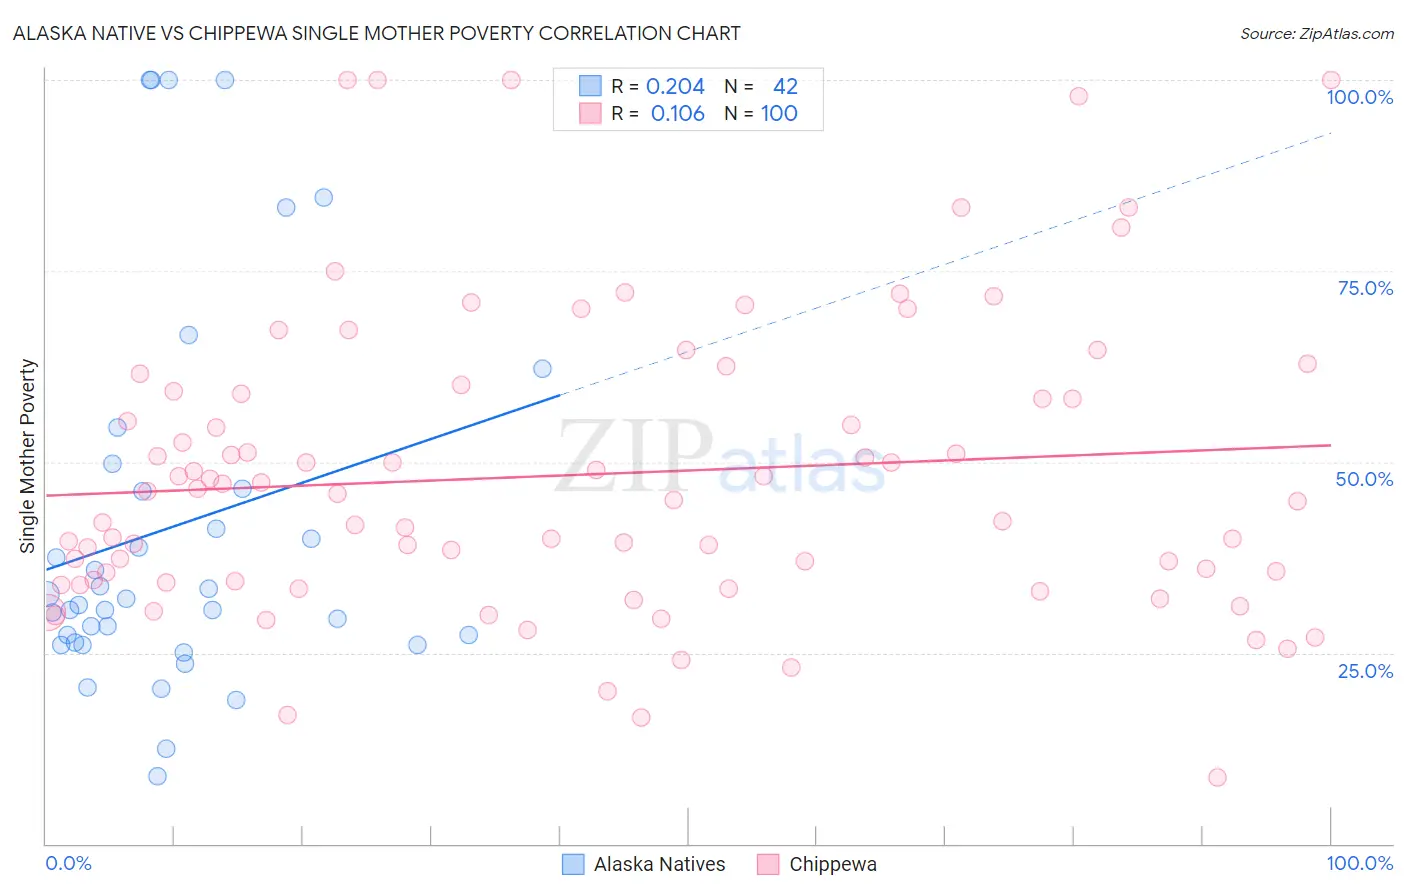
Alaska Native vs Chippewa Single Mother Poverty Correlation Chart
The statistical analysis conducted on geographies consisting of 76,488,214 people shows a weak positive correlation between the proportion of Alaska Natives and poverty level among single mothers in the United States with a correlation coefficient (R) of 0.204 and weighted average of 30.9%. Similarly, the statistical analysis conducted on geographies consisting of 212,048,110 people shows a poor positive correlation between the proportion of Chippewa and poverty level among single mothers in the United States with a correlation coefficient (R) of 0.106 and weighted average of 34.8%, a difference of 12.4%.
Single Mother Poverty Correlation Summary
| Measurement | Alaska Native | Chippewa |
| Minimum | 8.8% | 8.7% |
| Maximum | 100.0% | 100.0% |
| Range | 91.2% | 91.3% |
| Mean | 41.6% | 48.3% |
| Median | 31.7% | 45.4% |
| Interquartile 25% (IQ1) | 26.3% | 34.3% |
| Interquartile 75% (IQ3) | 46.5% | 59.1% |
| Interquartile Range (IQR) | 20.2% | 24.8% |
| Standard Deviation (Sample) | 24.9% | 19.5% |
| Standard Deviation (Population) | 24.6% | 19.4% |
Similar Demographics by Single Mother Poverty
Demographics Similar to Alaska Natives by Single Mother Poverty
In terms of single mother poverty, the demographic groups most similar to Alaska Natives are Tlingit-Haida (30.9%, a difference of 0.010%), Celtic (30.9%, a difference of 0.030%), Vietnamese (30.9%, a difference of 0.13%), Senegalese (31.0%, a difference of 0.18%), and Cape Verdean (30.8%, a difference of 0.28%).
| Demographics | Rating | Rank | Single Mother Poverty |
| Barbadians | 1.3 /100 | #245 | Tragic 30.7% |
| Ecuadorians | 0.9 /100 | #246 | Tragic 30.8% |
| West Indians | 0.9 /100 | #247 | Tragic 30.8% |
| French Canadians | 0.9 /100 | #248 | Tragic 30.8% |
| Cape Verdeans | 0.8 /100 | #249 | Tragic 30.8% |
| Vietnamese | 0.7 /100 | #250 | Tragic 30.9% |
| Tlingit-Haida | 0.6 /100 | #251 | Tragic 30.9% |
| Alaska Natives | 0.6 /100 | #252 | Tragic 30.9% |
| Celtics | 0.6 /100 | #253 | Tragic 30.9% |
| Senegalese | 0.5 /100 | #254 | Tragic 31.0% |
| Belizeans | 0.5 /100 | #255 | Tragic 31.0% |
| Immigrants | West Indies | 0.4 /100 | #256 | Tragic 31.1% |
| Immigrants | Bahamas | 0.4 /100 | #257 | Tragic 31.1% |
| Immigrants | Caribbean | 0.4 /100 | #258 | Tragic 31.1% |
| Immigrants | Bangladesh | 0.4 /100 | #259 | Tragic 31.1% |
Demographics Similar to Chippewa by Single Mother Poverty
In terms of single mother poverty, the demographic groups most similar to Chippewa are Immigrants from Honduras (34.7%, a difference of 0.15%), Iroquois (34.8%, a difference of 0.24%), Cherokee (34.5%, a difference of 0.67%), Dominican (34.5%, a difference of 0.78%), and Hopi (34.5%, a difference of 0.90%).
| Demographics | Rating | Rank | Single Mother Poverty |
| Central American Indians | 0.0 /100 | #312 | Tragic 34.3% |
| Immigrants | Dominican Republic | 0.0 /100 | #313 | Tragic 34.4% |
| Chickasaw | 0.0 /100 | #314 | Tragic 34.4% |
| Hopi | 0.0 /100 | #315 | Tragic 34.5% |
| Dominicans | 0.0 /100 | #316 | Tragic 34.5% |
| Cherokee | 0.0 /100 | #317 | Tragic 34.5% |
| Immigrants | Honduras | 0.0 /100 | #318 | Tragic 34.7% |
| Chippewa | 0.0 /100 | #319 | Tragic 34.8% |
| Iroquois | 0.0 /100 | #320 | Tragic 34.8% |
| Paiute | 0.0 /100 | #321 | Tragic 35.1% |
| Blacks/African Americans | 0.0 /100 | #322 | Tragic 35.2% |
| Kiowa | 0.0 /100 | #323 | Tragic 35.5% |
| Ottawa | 0.0 /100 | #324 | Tragic 35.5% |
| Ute | 0.0 /100 | #325 | Tragic 35.7% |
| Seminole | 0.0 /100 | #326 | Tragic 35.8% |