Immigrants from Dominican Republic vs Menominee Single Mother Poverty
COMPARE
Immigrants from Dominican Republic
Menominee
Single Mother Poverty
Single Mother Poverty Comparison
Immigrants from Dominican Republic
Menominee
34.4%
SINGLE MOTHER POVERTY
0.0/ 100
METRIC RATING
313th/ 347
METRIC RANK
37.1%
SINGLE MOTHER POVERTY
0.0/ 100
METRIC RATING
333rd/ 347
METRIC RANK
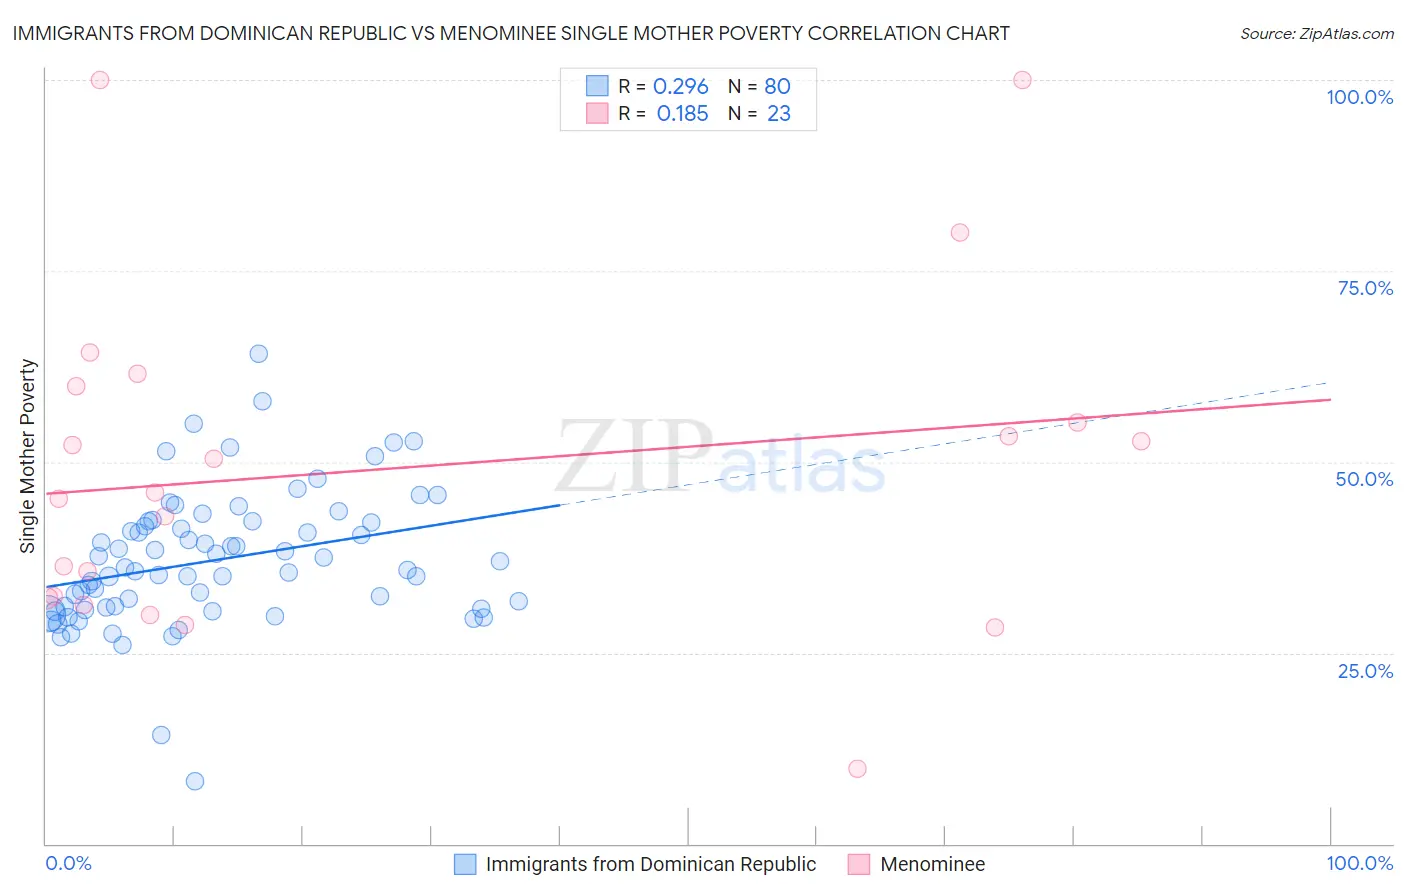
Immigrants from Dominican Republic vs Menominee Single Mother Poverty Correlation Chart
The statistical analysis conducted on geographies consisting of 269,699,812 people shows a weak positive correlation between the proportion of Immigrants from Dominican Republic and poverty level among single mothers in the United States with a correlation coefficient (R) of 0.296 and weighted average of 34.4%. Similarly, the statistical analysis conducted on geographies consisting of 45,498,385 people shows a poor positive correlation between the proportion of Menominee and poverty level among single mothers in the United States with a correlation coefficient (R) of 0.185 and weighted average of 37.1%, a difference of 7.8%.
Single Mother Poverty Correlation Summary
| Measurement | Immigrants from Dominican Republic | Menominee |
| Minimum | 8.3% | 9.8% |
| Maximum | 64.2% | 100.0% |
| Range | 56.0% | 90.2% |
| Mean | 37.1% | 49.1% |
| Median | 36.0% | 46.0% |
| Interquartile 25% (IQ1) | 30.8% | 32.1% |
| Interquartile 75% (IQ3) | 42.1% | 59.9% |
| Interquartile Range (IQR) | 11.3% | 27.8% |
| Standard Deviation (Sample) | 8.9% | 22.1% |
| Standard Deviation (Population) | 8.9% | 21.6% |
Demographics Similar to Immigrants from Dominican Republic and Menominee by Single Mother Poverty
In terms of single mother poverty, the demographic groups most similar to Immigrants from Dominican Republic are Chickasaw (34.4%, a difference of 0.17%), Hopi (34.5%, a difference of 0.25%), Dominican (34.5%, a difference of 0.37%), Cherokee (34.5%, a difference of 0.48%), and Immigrants from Honduras (34.7%, a difference of 1.0%). Similarly, the demographic groups most similar to Menominee are Dutch West Indian (36.8%, a difference of 0.78%), Creek (36.7%, a difference of 1.0%), Native/Alaskan (36.6%, a difference of 1.2%), Apache (36.6%, a difference of 1.3%), and Choctaw (36.4%, a difference of 1.8%).
| Demographics | Rating | Rank | Single Mother Poverty |
| Immigrants | Dominican Republic | 0.0 /100 | #313 | Tragic 34.4% |
| Chickasaw | 0.0 /100 | #314 | Tragic 34.4% |
| Hopi | 0.0 /100 | #315 | Tragic 34.5% |
| Dominicans | 0.0 /100 | #316 | Tragic 34.5% |
| Cherokee | 0.0 /100 | #317 | Tragic 34.5% |
| Immigrants | Honduras | 0.0 /100 | #318 | Tragic 34.7% |
| Chippewa | 0.0 /100 | #319 | Tragic 34.8% |
| Iroquois | 0.0 /100 | #320 | Tragic 34.8% |
| Paiute | 0.0 /100 | #321 | Tragic 35.1% |
| Blacks/African Americans | 0.0 /100 | #322 | Tragic 35.2% |
| Kiowa | 0.0 /100 | #323 | Tragic 35.5% |
| Ottawa | 0.0 /100 | #324 | Tragic 35.5% |
| Ute | 0.0 /100 | #325 | Tragic 35.7% |
| Seminole | 0.0 /100 | #326 | Tragic 35.8% |
| Yakama | 0.0 /100 | #327 | Tragic 36.4% |
| Choctaw | 0.0 /100 | #328 | Tragic 36.4% |
| Apache | 0.0 /100 | #329 | Tragic 36.6% |
| Natives/Alaskans | 0.0 /100 | #330 | Tragic 36.6% |
| Creek | 0.0 /100 | #331 | Tragic 36.7% |
| Dutch West Indians | 0.0 /100 | #332 | Tragic 36.8% |
| Menominee | 0.0 /100 | #333 | Tragic 37.1% |