Immigrants from Senegal vs Menominee Single Mother Poverty
COMPARE
Immigrants from Senegal
Menominee
Single Mother Poverty
Single Mother Poverty Comparison
Immigrants from Senegal
Menominee
31.5%
SINGLE MOTHER POVERTY
0.1/ 100
METRIC RATING
268th/ 347
METRIC RANK
37.1%
SINGLE MOTHER POVERTY
0.0/ 100
METRIC RATING
333rd/ 347
METRIC RANK
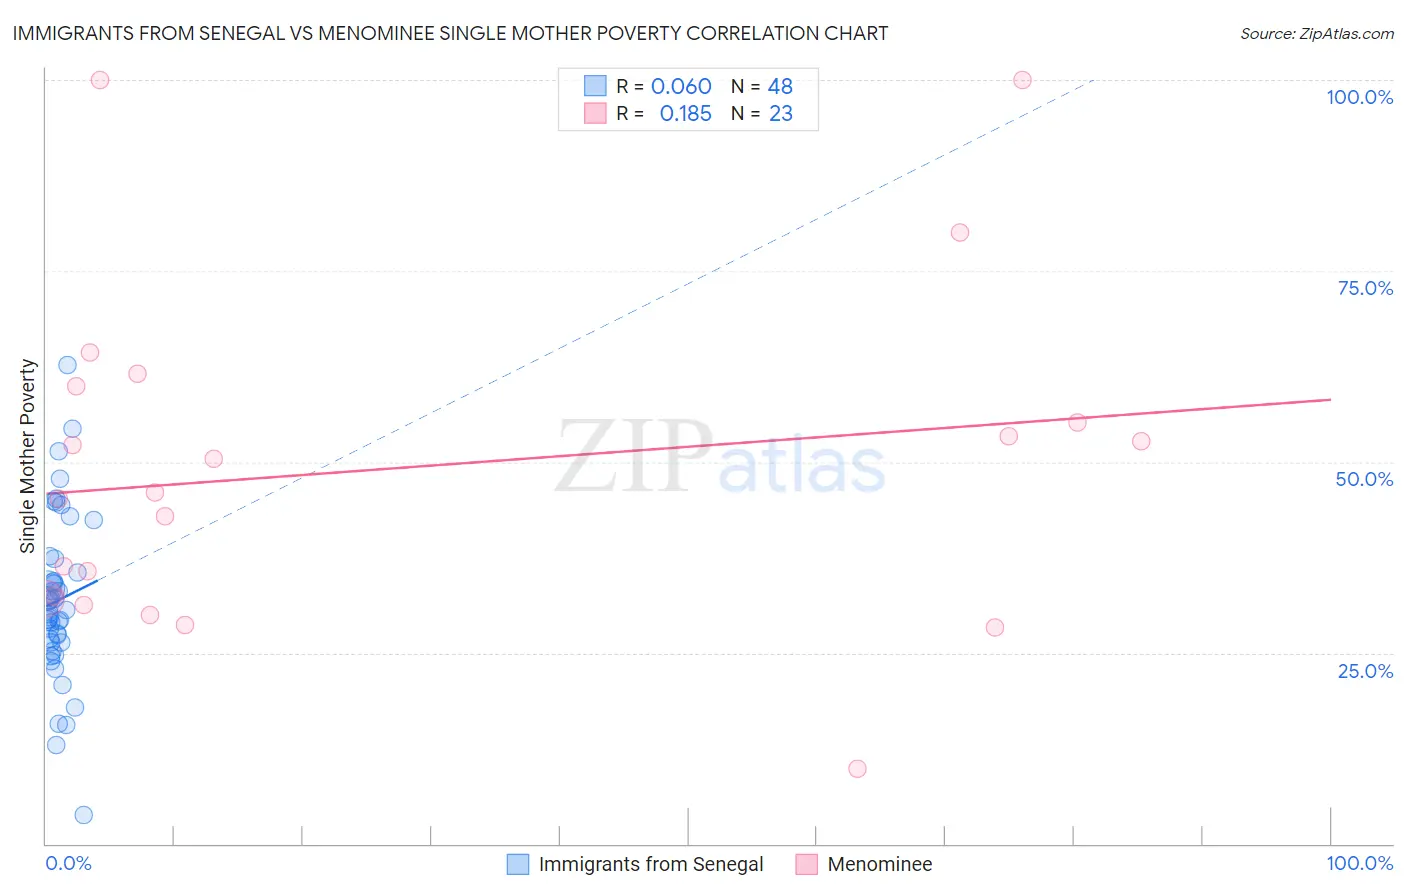
Immigrants from Senegal vs Menominee Single Mother Poverty Correlation Chart
The statistical analysis conducted on geographies consisting of 89,735,175 people shows a slight positive correlation between the proportion of Immigrants from Senegal and poverty level among single mothers in the United States with a correlation coefficient (R) of 0.060 and weighted average of 31.5%. Similarly, the statistical analysis conducted on geographies consisting of 45,498,385 people shows a poor positive correlation between the proportion of Menominee and poverty level among single mothers in the United States with a correlation coefficient (R) of 0.185 and weighted average of 37.1%, a difference of 17.8%.
Single Mother Poverty Correlation Summary
| Measurement | Immigrants from Senegal | Menominee |
| Minimum | 3.8% | 9.8% |
| Maximum | 62.7% | 100.0% |
| Range | 58.9% | 90.2% |
| Mean | 31.8% | 49.1% |
| Median | 30.4% | 46.0% |
| Interquartile 25% (IQ1) | 26.3% | 32.1% |
| Interquartile 75% (IQ3) | 36.4% | 59.9% |
| Interquartile Range (IQR) | 10.1% | 27.8% |
| Standard Deviation (Sample) | 10.9% | 22.1% |
| Standard Deviation (Population) | 10.8% | 21.6% |
Similar Demographics by Single Mother Poverty
Demographics Similar to Immigrants from Senegal by Single Mother Poverty
In terms of single mother poverty, the demographic groups most similar to Immigrants from Senegal are Scotch-Irish (31.5%, a difference of 0.040%), British West Indian (31.5%, a difference of 0.090%), Immigrants from Belize (31.4%, a difference of 0.18%), Subsaharan African (31.4%, a difference of 0.33%), and Immigrants from Cabo Verde (31.6%, a difference of 0.33%).
| Demographics | Rating | Rank | Single Mother Poverty |
| Immigrants | El Salvador | 0.3 /100 | #261 | Tragic 31.2% |
| Hmong | 0.3 /100 | #262 | Tragic 31.2% |
| Bahamians | 0.2 /100 | #263 | Tragic 31.3% |
| Immigrants | Ecuador | 0.2 /100 | #264 | Tragic 31.3% |
| German Russians | 0.2 /100 | #265 | Tragic 31.3% |
| Sub-Saharan Africans | 0.2 /100 | #266 | Tragic 31.4% |
| Immigrants | Belize | 0.2 /100 | #267 | Tragic 31.4% |
| Immigrants | Senegal | 0.1 /100 | #268 | Tragic 31.5% |
| Scotch-Irish | 0.1 /100 | #269 | Tragic 31.5% |
| British West Indians | 0.1 /100 | #270 | Tragic 31.5% |
| Immigrants | Cabo Verde | 0.1 /100 | #271 | Tragic 31.6% |
| Immigrants | Micronesia | 0.1 /100 | #272 | Tragic 31.6% |
| Fijians | 0.1 /100 | #273 | Tragic 31.6% |
| Bangladeshis | 0.1 /100 | #274 | Tragic 31.7% |
| Central Americans | 0.1 /100 | #275 | Tragic 31.8% |
Demographics Similar to Menominee by Single Mother Poverty
In terms of single mother poverty, the demographic groups most similar to Menominee are Pueblo (37.2%, a difference of 0.37%), Dutch West Indian (36.8%, a difference of 0.78%), Creek (36.7%, a difference of 1.0%), Native/Alaskan (36.6%, a difference of 1.2%), and Apache (36.6%, a difference of 1.3%).
| Demographics | Rating | Rank | Single Mother Poverty |
| Seminole | 0.0 /100 | #326 | Tragic 35.8% |
| Yakama | 0.0 /100 | #327 | Tragic 36.4% |
| Choctaw | 0.0 /100 | #328 | Tragic 36.4% |
| Apache | 0.0 /100 | #329 | Tragic 36.6% |
| Natives/Alaskans | 0.0 /100 | #330 | Tragic 36.6% |
| Creek | 0.0 /100 | #331 | Tragic 36.7% |
| Dutch West Indians | 0.0 /100 | #332 | Tragic 36.8% |
| Menominee | 0.0 /100 | #333 | Tragic 37.1% |
| Pueblo | 0.0 /100 | #334 | Tragic 37.2% |
| Yuman | 0.0 /100 | #335 | Tragic 37.8% |
| Cheyenne | 0.0 /100 | #336 | Tragic 38.5% |
| Immigrants | Yemen | 0.0 /100 | #337 | Tragic 38.5% |
| Pima | 0.0 /100 | #338 | Tragic 38.6% |
| Crow | 0.0 /100 | #339 | Tragic 38.6% |
| Sioux | 0.0 /100 | #340 | Tragic 38.8% |