Irish vs Menominee Median Household Income
COMPARE
Irish
Menominee
Median Household Income
Median Household Income Comparison
Irish
Menominee
$86,145
MEDIAN HOUSEHOLD INCOME
66.2/ 100
METRIC RATING
164th/ 347
METRIC RANK
$68,423
MEDIAN HOUSEHOLD INCOME
0.0/ 100
METRIC RATING
328th/ 347
METRIC RANK
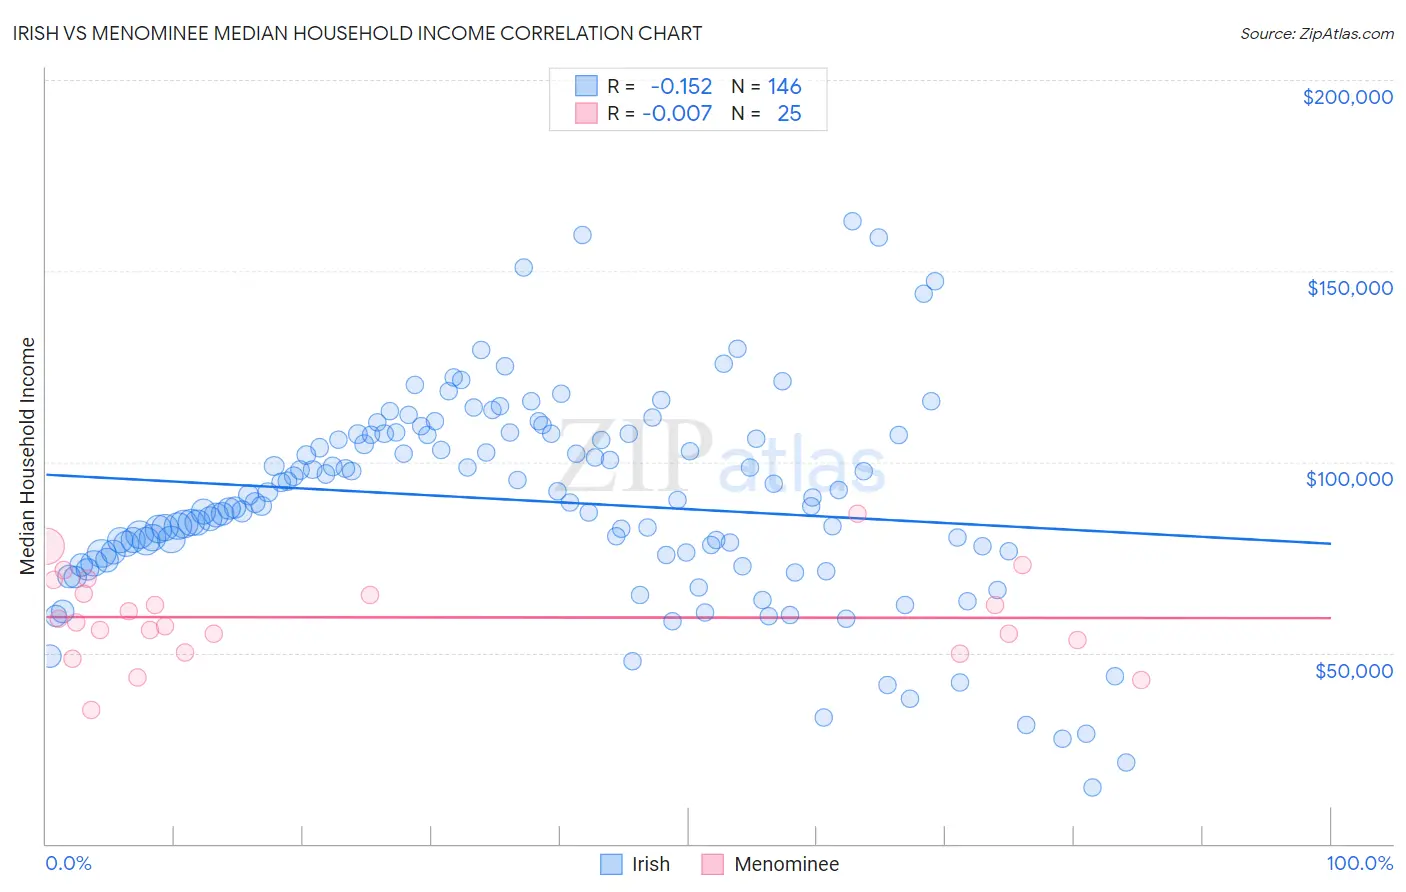
Irish vs Menominee Median Household Income Correlation Chart
The statistical analysis conducted on geographies consisting of 579,055,037 people shows a poor negative correlation between the proportion of Irish and median household income in the United States with a correlation coefficient (R) of -0.152 and weighted average of $86,145. Similarly, the statistical analysis conducted on geographies consisting of 45,776,591 people shows no correlation between the proportion of Menominee and median household income in the United States with a correlation coefficient (R) of -0.007 and weighted average of $68,423, a difference of 25.9%.
Median Household Income Correlation Summary
| Measurement | Irish | Menominee |
| Minimum | $14,837 | $35,112 |
| Maximum | $162,948 | $86,563 |
| Range | $148,111 | $51,451 |
| Mean | $89,921 | $59,292 |
| Median | $89,704 | $57,897 |
| Interquartile 25% (IQ1) | $76,304 | $51,640 |
| Interquartile 75% (IQ3) | $107,042 | $67,237 |
| Interquartile Range (IQR) | $30,738 | $15,596 |
| Standard Deviation (Sample) | $26,625 | $11,591 |
| Standard Deviation (Population) | $26,534 | $11,357 |
Similar Demographics by Median Household Income
Demographics Similar to Irish by Median Household Income
In terms of median household income, the demographic groups most similar to Irish are Czech ($86,164, a difference of 0.020%), Norwegian ($86,084, a difference of 0.070%), Scandinavian ($86,073, a difference of 0.080%), Guamanian/Chamorro ($86,255, a difference of 0.13%), and Slavic ($86,398, a difference of 0.29%).
| Demographics | Rating | Rank | Median Household Income |
| Samoans | 71.0 /100 | #157 | Good $86,498 |
| Moroccans | 70.6 /100 | #158 | Good $86,468 |
| Immigrants | Uzbekistan | 70.1 /100 | #159 | Good $86,425 |
| Luxembourgers | 70.0 /100 | #160 | Good $86,418 |
| Slavs | 69.7 /100 | #161 | Good $86,398 |
| Guamanians/Chamorros | 67.7 /100 | #162 | Good $86,255 |
| Czechs | 66.4 /100 | #163 | Good $86,164 |
| Irish | 66.2 /100 | #164 | Good $86,145 |
| Norwegians | 65.3 /100 | #165 | Good $86,084 |
| Scandinavians | 65.1 /100 | #166 | Good $86,073 |
| Immigrants | Immigrants | 61.3 /100 | #167 | Good $85,818 |
| Icelanders | 61.0 /100 | #168 | Good $85,797 |
| Colombians | 59.7 /100 | #169 | Average $85,716 |
| Swiss | 59.2 /100 | #170 | Average $85,681 |
| Immigrants | South America | 58.1 /100 | #171 | Average $85,611 |
Demographics Similar to Menominee by Median Household Income
In terms of median household income, the demographic groups most similar to Menominee are Dutch West Indian ($68,412, a difference of 0.020%), Immigrants from Cuba ($68,461, a difference of 0.060%), Yuman ($68,743, a difference of 0.47%), Arapaho ($67,965, a difference of 0.67%), and Native/Alaskan ($67,879, a difference of 0.80%).
| Demographics | Rating | Rank | Median Household Income |
| Chickasaw | 0.0 /100 | #321 | Tragic $70,005 |
| Choctaw | 0.0 /100 | #322 | Tragic $69,947 |
| Bahamians | 0.0 /100 | #323 | Tragic $69,726 |
| Yup'ik | 0.0 /100 | #324 | Tragic $69,695 |
| Seminole | 0.0 /100 | #325 | Tragic $69,420 |
| Yuman | 0.0 /100 | #326 | Tragic $68,743 |
| Immigrants | Cuba | 0.0 /100 | #327 | Tragic $68,461 |
| Menominee | 0.0 /100 | #328 | Tragic $68,423 |
| Dutch West Indians | 0.0 /100 | #329 | Tragic $68,412 |
| Arapaho | 0.0 /100 | #330 | Tragic $67,965 |
| Natives/Alaskans | 0.0 /100 | #331 | Tragic $67,879 |
| Sioux | 0.0 /100 | #332 | Tragic $67,792 |
| Creek | 0.0 /100 | #333 | Tragic $67,715 |
| Blacks/African Americans | 0.0 /100 | #334 | Tragic $67,573 |
| Cheyenne | 0.0 /100 | #335 | Tragic $66,974 |