Irish vs Lithuanian Divorced or Separated
COMPARE
Irish
Lithuanian
Divorced or Separated
Divorced or Separated Comparison
Irish
Lithuanians
12.5%
DIVORCED OR SEPARATED
1.3/ 100
METRIC RATING
250th/ 347
METRIC RANK
11.7%
DIVORCED OR SEPARATED
95.7/ 100
METRIC RATING
115th/ 347
METRIC RANK
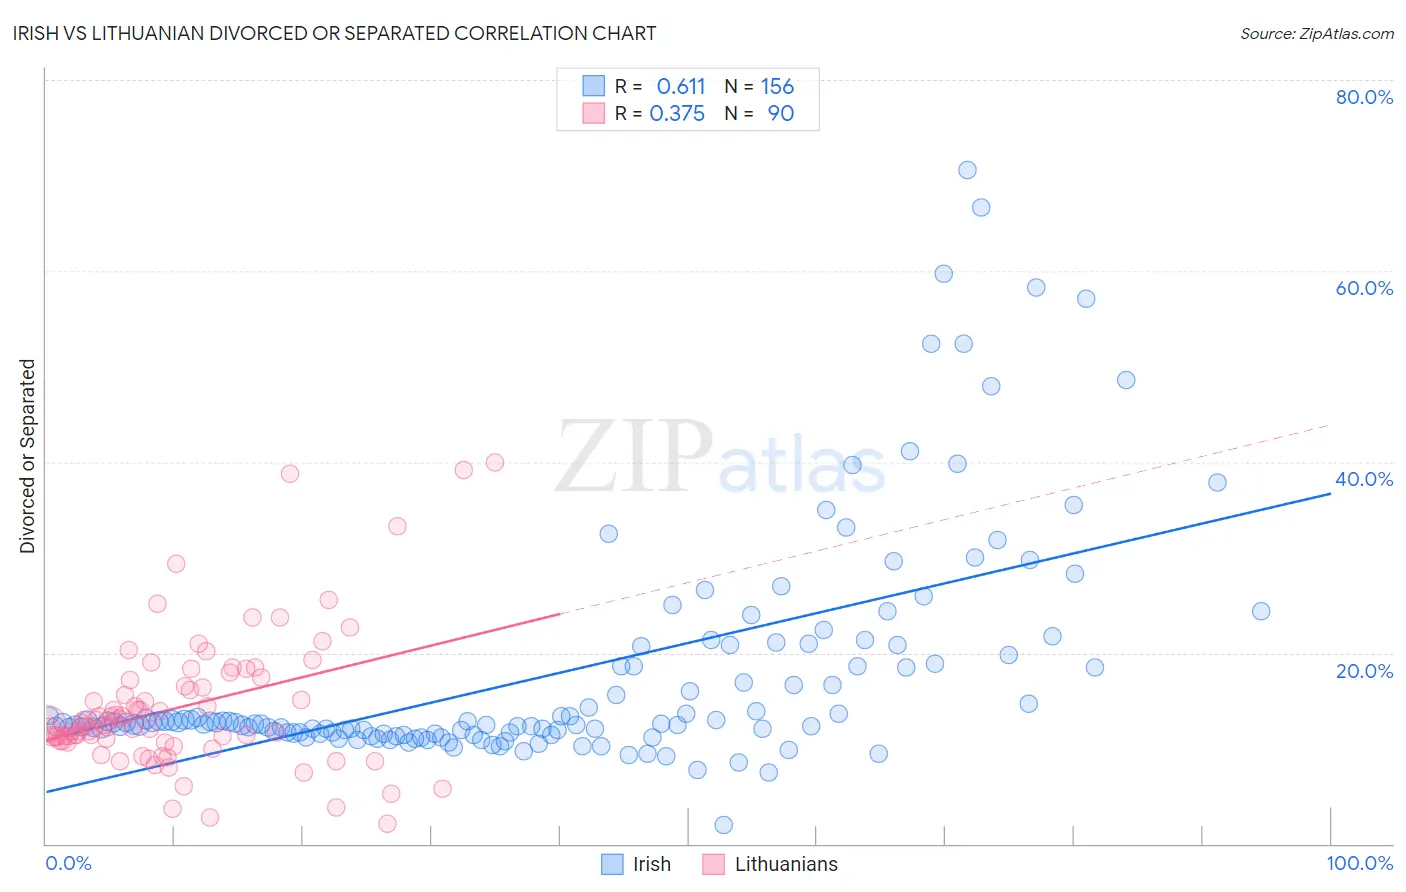
Irish vs Lithuanian Divorced or Separated Correlation Chart
The statistical analysis conducted on geographies consisting of 580,050,649 people shows a significant positive correlation between the proportion of Irish and percentage of population currently divorced or separated in the United States with a correlation coefficient (R) of 0.611 and weighted average of 12.5%. Similarly, the statistical analysis conducted on geographies consisting of 421,781,235 people shows a mild positive correlation between the proportion of Lithuanians and percentage of population currently divorced or separated in the United States with a correlation coefficient (R) of 0.375 and weighted average of 11.7%, a difference of 6.6%.
Divorced or Separated Correlation Summary
| Measurement | Irish | Lithuanian |
| Minimum | 2.0% | 2.1% |
| Maximum | 70.6% | 40.0% |
| Range | 68.7% | 37.9% |
| Mean | 17.8% | 14.4% |
| Median | 12.7% | 12.5% |
| Interquartile 25% (IQ1) | 11.6% | 10.8% |
| Interquartile 75% (IQ3) | 19.3% | 17.1% |
| Interquartile Range (IQR) | 7.7% | 6.3% |
| Standard Deviation (Sample) | 12.1% | 7.2% |
| Standard Deviation (Population) | 12.1% | 7.2% |
Similar Demographics by Divorced or Separated
Demographics Similar to Irish by Divorced or Separated
In terms of divorced or separated, the demographic groups most similar to Irish are Aleut (12.5%, a difference of 0.0%), Finnish (12.5%, a difference of 0.27%), Nepalese (12.5%, a difference of 0.29%), German (12.5%, a difference of 0.31%), and Liberian (12.6%, a difference of 0.33%).
| Demographics | Rating | Rank | Divorced or Separated |
| Immigrants | Latin America | 2.8 /100 | #243 | Tragic 12.4% |
| Alaska Natives | 2.5 /100 | #244 | Tragic 12.4% |
| Hispanics or Latinos | 2.0 /100 | #245 | Tragic 12.5% |
| Immigrants | West Indies | 1.9 /100 | #246 | Tragic 12.5% |
| Germans | 1.8 /100 | #247 | Tragic 12.5% |
| Nepalese | 1.8 /100 | #248 | Tragic 12.5% |
| Finns | 1.8 /100 | #249 | Tragic 12.5% |
| Irish | 1.3 /100 | #250 | Tragic 12.5% |
| Aleuts | 1.3 /100 | #251 | Tragic 12.5% |
| Liberians | 0.9 /100 | #252 | Tragic 12.6% |
| Somalis | 0.9 /100 | #253 | Tragic 12.6% |
| Senegalese | 0.8 /100 | #254 | Tragic 12.6% |
| Welsh | 0.7 /100 | #255 | Tragic 12.6% |
| Immigrants | Colombia | 0.6 /100 | #256 | Tragic 12.6% |
| Immigrants | Somalia | 0.6 /100 | #257 | Tragic 12.6% |
Demographics Similar to Lithuanians by Divorced or Separated
In terms of divorced or separated, the demographic groups most similar to Lithuanians are Immigrants from Norway (11.7%, a difference of 0.050%), Immigrants from Iraq (11.7%, a difference of 0.060%), Immigrants from Uganda (11.7%, a difference of 0.080%), Ecuadorian (11.7%, a difference of 0.090%), and Syrian (11.7%, a difference of 0.13%).
| Demographics | Rating | Rank | Divorced or Separated |
| Greeks | 96.9 /100 | #108 | Exceptional 11.7% |
| Immigrants | South Africa | 96.9 /100 | #109 | Exceptional 11.7% |
| Immigrants | Czechoslovakia | 96.9 /100 | #110 | Exceptional 11.7% |
| Immigrants | Spain | 96.8 /100 | #111 | Exceptional 11.7% |
| Immigrants | France | 96.6 /100 | #112 | Exceptional 11.7% |
| Estonians | 96.6 /100 | #113 | Exceptional 11.7% |
| Immigrants | Norway | 95.9 /100 | #114 | Exceptional 11.7% |
| Lithuanians | 95.7 /100 | #115 | Exceptional 11.7% |
| Immigrants | Iraq | 95.4 /100 | #116 | Exceptional 11.7% |
| Immigrants | Uganda | 95.3 /100 | #117 | Exceptional 11.7% |
| Ecuadorians | 95.3 /100 | #118 | Exceptional 11.7% |
| Syrians | 95.1 /100 | #119 | Exceptional 11.7% |
| Iraqis | 94.6 /100 | #120 | Exceptional 11.8% |
| Romanians | 94.5 /100 | #121 | Exceptional 11.8% |
| Menominee | 93.8 /100 | #122 | Exceptional 11.8% |