Irish vs Italian Female Poverty
COMPARE
Irish
Italian
Female Poverty
Female Poverty Comparison
Irish
Italians
12.4%
FEMALE POVERTY
96.5/ 100
METRIC RATING
85th/ 347
METRIC RANK
11.6%
FEMALE POVERTY
99.7/ 100
METRIC RATING
21st/ 347
METRIC RANK
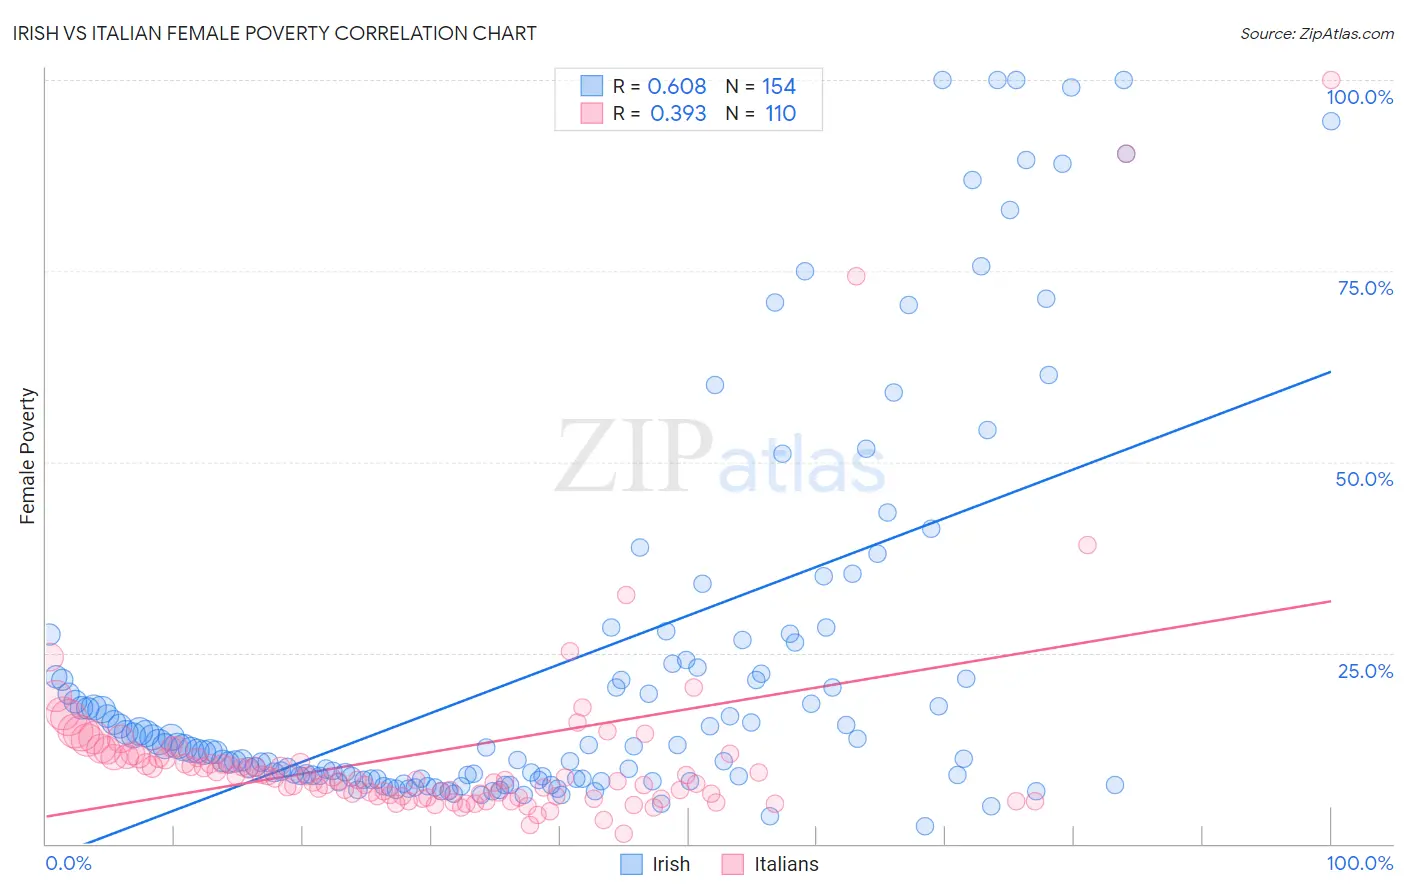
Irish vs Italian Female Poverty Correlation Chart
The statistical analysis conducted on geographies consisting of 578,836,064 people shows a significant positive correlation between the proportion of Irish and poverty level among females in the United States with a correlation coefficient (R) of 0.608 and weighted average of 12.4%. Similarly, the statistical analysis conducted on geographies consisting of 573,632,055 people shows a mild positive correlation between the proportion of Italians and poverty level among females in the United States with a correlation coefficient (R) of 0.393 and weighted average of 11.6%, a difference of 6.8%.
Female Poverty Correlation Summary
| Measurement | Irish | Italian |
| Minimum | 2.3% | 1.3% |
| Maximum | 100.0% | 100.0% |
| Range | 97.7% | 98.7% |
| Mean | 23.1% | 11.8% |
| Median | 12.6% | 8.5% |
| Interquartile 25% (IQ1) | 8.5% | 6.3% |
| Interquartile 75% (IQ3) | 23.0% | 11.4% |
| Interquartile Range (IQR) | 14.6% | 5.1% |
| Standard Deviation (Sample) | 24.9% | 14.1% |
| Standard Deviation (Population) | 24.8% | 14.0% |
Similar Demographics by Female Poverty
Demographics Similar to Irish by Female Poverty
In terms of female poverty, the demographic groups most similar to Irish are Dutch (12.4%, a difference of 0.030%), Northern European (12.4%, a difference of 0.050%), Okinawan (12.4%, a difference of 0.050%), Finnish (12.4%, a difference of 0.090%), and Immigrants from England (12.3%, a difference of 0.29%).
| Demographics | Rating | Rank | Female Poverty |
| Egyptians | 97.2 /100 | #78 | Exceptional 12.3% |
| Immigrants | North America | 97.1 /100 | #79 | Exceptional 12.3% |
| Slovaks | 97.1 /100 | #80 | Exceptional 12.3% |
| Immigrants | Sweden | 97.1 /100 | #81 | Exceptional 12.3% |
| Jordanians | 97.1 /100 | #82 | Exceptional 12.3% |
| Immigrants | England | 96.9 /100 | #83 | Exceptional 12.3% |
| Northern Europeans | 96.6 /100 | #84 | Exceptional 12.4% |
| Irish | 96.5 /100 | #85 | Exceptional 12.4% |
| Dutch | 96.5 /100 | #86 | Exceptional 12.4% |
| Okinawans | 96.4 /100 | #87 | Exceptional 12.4% |
| Finns | 96.4 /100 | #88 | Exceptional 12.4% |
| English | 96.1 /100 | #89 | Exceptional 12.4% |
| Immigrants | Denmark | 95.8 /100 | #90 | Exceptional 12.4% |
| Belgians | 95.8 /100 | #91 | Exceptional 12.4% |
| Czechoslovakians | 95.7 /100 | #92 | Exceptional 12.4% |
Demographics Similar to Italians by Female Poverty
In terms of female poverty, the demographic groups most similar to Italians are Swedish (11.6%, a difference of 0.030%), Burmese (11.6%, a difference of 0.17%), Luxembourger (11.6%, a difference of 0.19%), Immigrants from Northern Europe (11.6%, a difference of 0.45%), and Croatian (11.6%, a difference of 0.46%).
| Demographics | Rating | Rank | Female Poverty |
| Lithuanians | 99.8 /100 | #14 | Exceptional 11.4% |
| Latvians | 99.8 /100 | #15 | Exceptional 11.4% |
| Immigrants | Bolivia | 99.8 /100 | #16 | Exceptional 11.5% |
| Bolivians | 99.8 /100 | #17 | Exceptional 11.5% |
| Immigrants | Scotland | 99.8 /100 | #18 | Exceptional 11.5% |
| Norwegians | 99.8 /100 | #19 | Exceptional 11.5% |
| Eastern Europeans | 99.7 /100 | #20 | Exceptional 11.5% |
| Italians | 99.7 /100 | #21 | Exceptional 11.6% |
| Swedes | 99.7 /100 | #22 | Exceptional 11.6% |
| Burmese | 99.7 /100 | #23 | Exceptional 11.6% |
| Luxembourgers | 99.7 /100 | #24 | Exceptional 11.6% |
| Immigrants | Northern Europe | 99.6 /100 | #25 | Exceptional 11.6% |
| Croatians | 99.6 /100 | #26 | Exceptional 11.6% |
| Iranians | 99.6 /100 | #27 | Exceptional 11.7% |
| Immigrants | Korea | 99.6 /100 | #28 | Exceptional 11.7% |