Immigrants from South Central Asia vs Italian Female Poverty
COMPARE
Immigrants from South Central Asia
Italian
Female Poverty
Female Poverty Comparison
Immigrants from South Central Asia
Italians
11.1%
FEMALE POVERTY
99.9/ 100
METRIC RATING
8th/ 347
METRIC RANK
11.6%
FEMALE POVERTY
99.7/ 100
METRIC RATING
21st/ 347
METRIC RANK
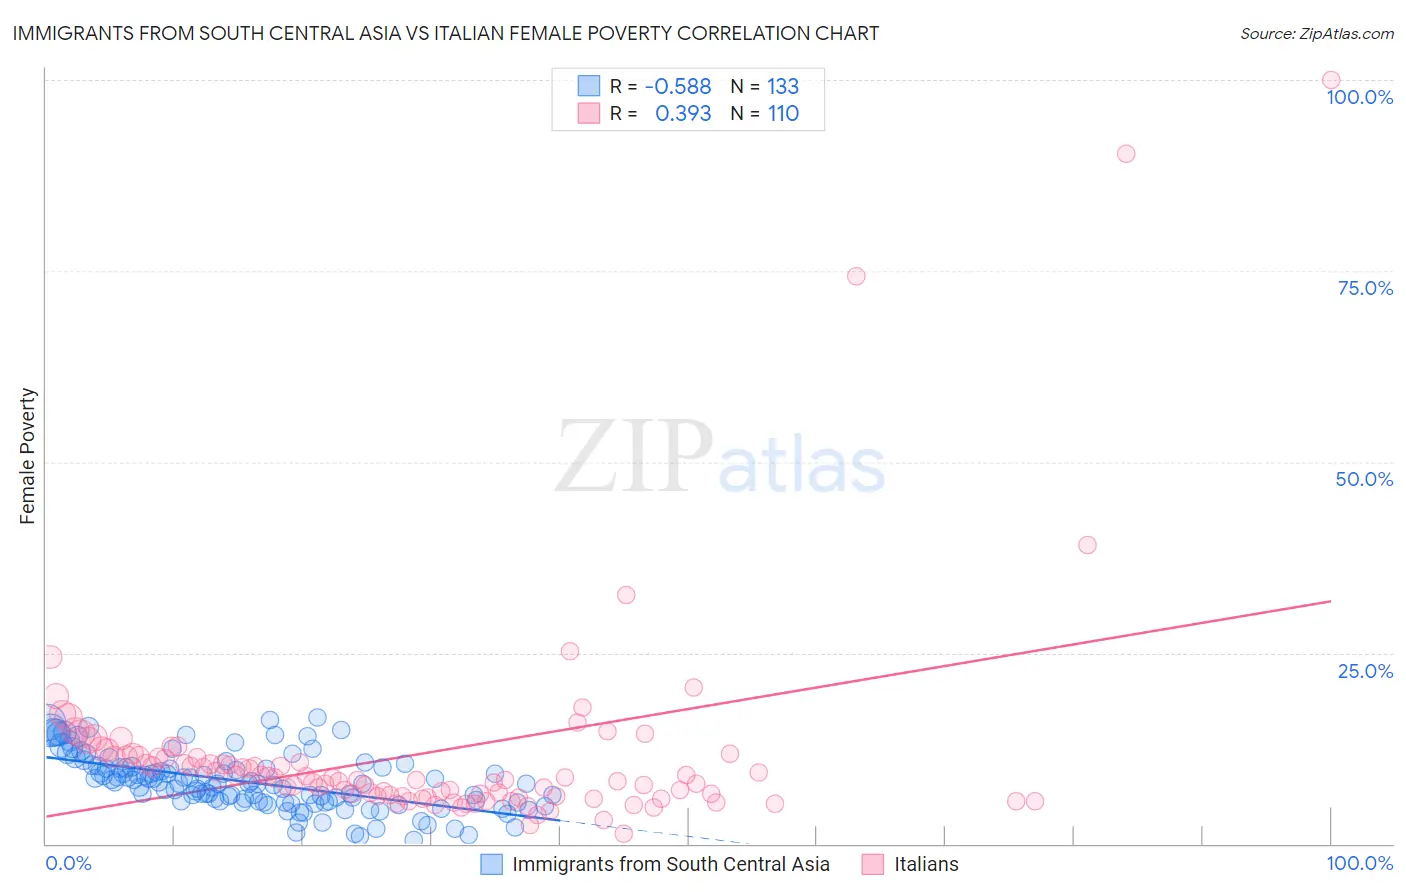
Immigrants from South Central Asia vs Italian Female Poverty Correlation Chart
The statistical analysis conducted on geographies consisting of 472,522,923 people shows a substantial negative correlation between the proportion of Immigrants from South Central Asia and poverty level among females in the United States with a correlation coefficient (R) of -0.588 and weighted average of 11.1%. Similarly, the statistical analysis conducted on geographies consisting of 573,632,055 people shows a mild positive correlation between the proportion of Italians and poverty level among females in the United States with a correlation coefficient (R) of 0.393 and weighted average of 11.6%, a difference of 4.3%.
Female Poverty Correlation Summary
| Measurement | Immigrants from South Central Asia | Italian |
| Minimum | 0.46% | 1.3% |
| Maximum | 16.5% | 100.0% |
| Range | 16.1% | 98.7% |
| Mean | 8.1% | 11.8% |
| Median | 7.9% | 8.5% |
| Interquartile 25% (IQ1) | 5.5% | 6.3% |
| Interquartile 75% (IQ3) | 10.0% | 11.4% |
| Interquartile Range (IQR) | 4.5% | 5.1% |
| Standard Deviation (Sample) | 3.6% | 14.1% |
| Standard Deviation (Population) | 3.6% | 14.0% |
Demographics Similar to Immigrants from South Central Asia and Italians by Female Poverty
In terms of female poverty, the demographic groups most similar to Immigrants from South Central Asia are Bulgarian (11.1%, a difference of 0.19%), Assyrian/Chaldean/Syriac (11.0%, a difference of 0.70%), Immigrants from Hong Kong (11.2%, a difference of 0.99%), Immigrants from Ireland (11.0%, a difference of 1.1%), and Maltese (11.2%, a difference of 1.1%). Similarly, the demographic groups most similar to Italians are Swedish (11.6%, a difference of 0.030%), Burmese (11.6%, a difference of 0.17%), Luxembourger (11.6%, a difference of 0.19%), Eastern European (11.5%, a difference of 0.50%), and Norwegian (11.5%, a difference of 0.73%).
| Demographics | Rating | Rank | Female Poverty |
| Immigrants | Taiwan | 100.0 /100 | #4 | Exceptional 10.5% |
| Filipinos | 100.0 /100 | #5 | Exceptional 10.9% |
| Immigrants | Ireland | 99.9 /100 | #6 | Exceptional 11.0% |
| Assyrians/Chaldeans/Syriacs | 99.9 /100 | #7 | Exceptional 11.0% |
| Immigrants | South Central Asia | 99.9 /100 | #8 | Exceptional 11.1% |
| Bulgarians | 99.9 /100 | #9 | Exceptional 11.1% |
| Immigrants | Hong Kong | 99.9 /100 | #10 | Exceptional 11.2% |
| Maltese | 99.9 /100 | #11 | Exceptional 11.2% |
| Bhutanese | 99.9 /100 | #12 | Exceptional 11.3% |
| Immigrants | Lithuania | 99.9 /100 | #13 | Exceptional 11.3% |
| Lithuanians | 99.8 /100 | #14 | Exceptional 11.4% |
| Latvians | 99.8 /100 | #15 | Exceptional 11.4% |
| Immigrants | Bolivia | 99.8 /100 | #16 | Exceptional 11.5% |
| Bolivians | 99.8 /100 | #17 | Exceptional 11.5% |
| Immigrants | Scotland | 99.8 /100 | #18 | Exceptional 11.5% |
| Norwegians | 99.8 /100 | #19 | Exceptional 11.5% |
| Eastern Europeans | 99.7 /100 | #20 | Exceptional 11.5% |
| Italians | 99.7 /100 | #21 | Exceptional 11.6% |
| Swedes | 99.7 /100 | #22 | Exceptional 11.6% |
| Burmese | 99.7 /100 | #23 | Exceptional 11.6% |
| Luxembourgers | 99.7 /100 | #24 | Exceptional 11.6% |