Ecuadorian vs Italian Female Poverty
COMPARE
Ecuadorian
Italian
Female Poverty
Female Poverty Comparison
Ecuadorians
Italians
15.3%
FEMALE POVERTY
0.3/ 100
METRIC RATING
244th/ 347
METRIC RANK
11.6%
FEMALE POVERTY
99.7/ 100
METRIC RATING
21st/ 347
METRIC RANK
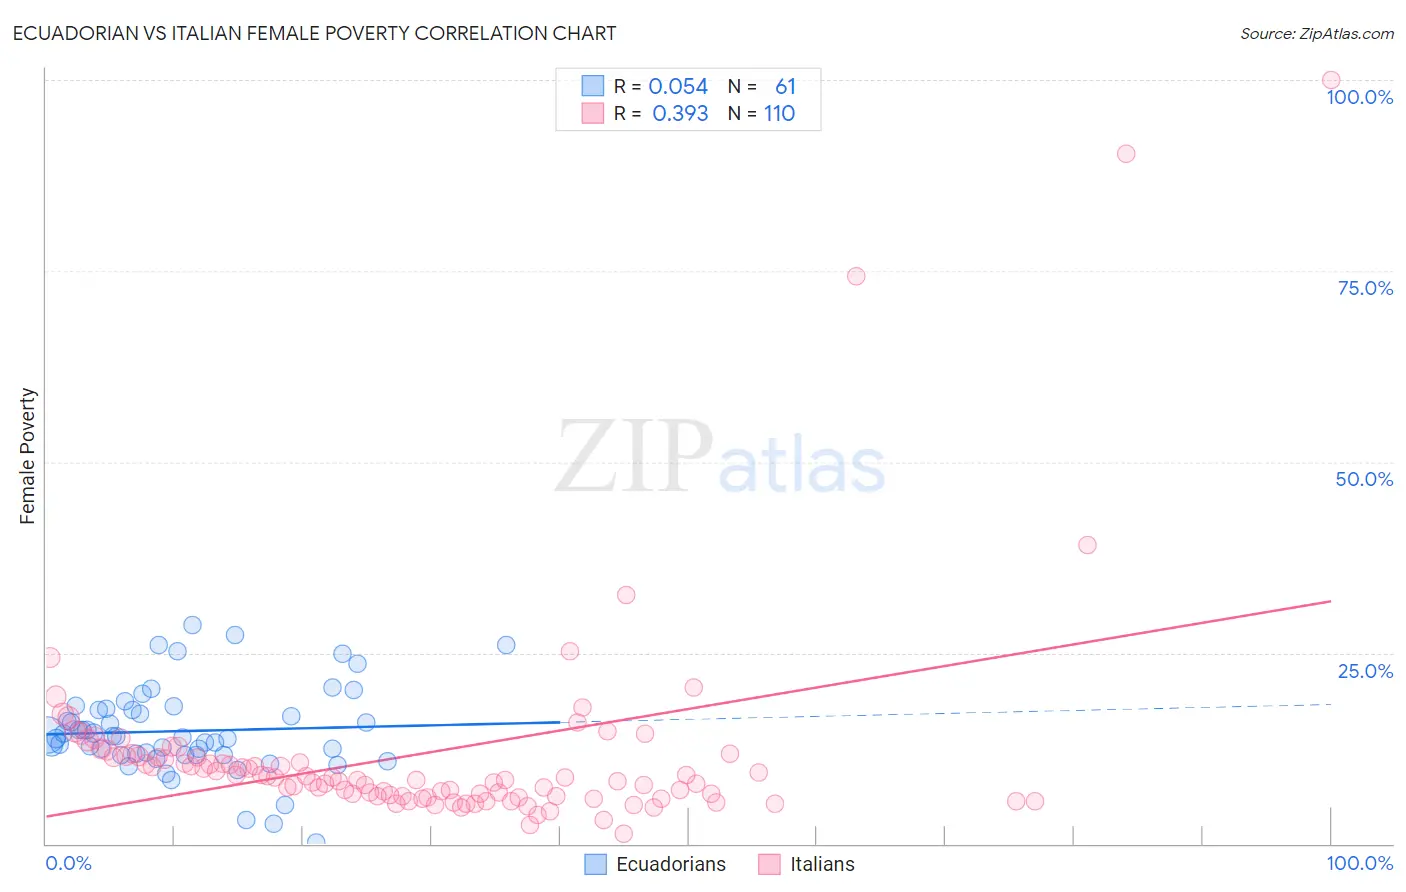
Ecuadorian vs Italian Female Poverty Correlation Chart
The statistical analysis conducted on geographies consisting of 317,585,196 people shows a slight positive correlation between the proportion of Ecuadorians and poverty level among females in the United States with a correlation coefficient (R) of 0.054 and weighted average of 15.3%. Similarly, the statistical analysis conducted on geographies consisting of 573,632,055 people shows a mild positive correlation between the proportion of Italians and poverty level among females in the United States with a correlation coefficient (R) of 0.393 and weighted average of 11.6%, a difference of 31.9%.
Female Poverty Correlation Summary
| Measurement | Ecuadorian | Italian |
| Minimum | 0.14% | 1.3% |
| Maximum | 28.7% | 100.0% |
| Range | 28.5% | 98.7% |
| Mean | 14.8% | 11.8% |
| Median | 14.1% | 8.5% |
| Interquartile 25% (IQ1) | 11.7% | 6.3% |
| Interquartile 75% (IQ3) | 17.6% | 11.4% |
| Interquartile Range (IQR) | 5.9% | 5.1% |
| Standard Deviation (Sample) | 5.7% | 14.1% |
| Standard Deviation (Population) | 5.7% | 14.0% |
Similar Demographics by Female Poverty
Demographics Similar to Ecuadorians by Female Poverty
In terms of female poverty, the demographic groups most similar to Ecuadorians are Nicaraguan (15.3%, a difference of 0.050%), Spanish American Indian (15.3%, a difference of 0.090%), Cuban (15.3%, a difference of 0.15%), Potawatomi (15.3%, a difference of 0.16%), and Immigrants from Ghana (15.3%, a difference of 0.16%).
| Demographics | Rating | Rank | Female Poverty |
| French American Indians | 0.6 /100 | #237 | Tragic 15.1% |
| Immigrants | Armenia | 0.6 /100 | #238 | Tragic 15.1% |
| Immigrants | Middle Africa | 0.5 /100 | #239 | Tragic 15.2% |
| Sudanese | 0.5 /100 | #240 | Tragic 15.2% |
| Immigrants | Sudan | 0.4 /100 | #241 | Tragic 15.2% |
| Nepalese | 0.4 /100 | #242 | Tragic 15.2% |
| Nicaraguans | 0.3 /100 | #243 | Tragic 15.3% |
| Ecuadorians | 0.3 /100 | #244 | Tragic 15.3% |
| Spanish American Indians | 0.3 /100 | #245 | Tragic 15.3% |
| Cubans | 0.3 /100 | #246 | Tragic 15.3% |
| Potawatomi | 0.3 /100 | #247 | Tragic 15.3% |
| Immigrants | Ghana | 0.3 /100 | #248 | Tragic 15.3% |
| Salvadorans | 0.3 /100 | #249 | Tragic 15.3% |
| Immigrants | Western Africa | 0.3 /100 | #250 | Tragic 15.3% |
| Immigrants | Trinidad and Tobago | 0.3 /100 | #251 | Tragic 15.4% |
Demographics Similar to Italians by Female Poverty
In terms of female poverty, the demographic groups most similar to Italians are Swedish (11.6%, a difference of 0.030%), Burmese (11.6%, a difference of 0.17%), Luxembourger (11.6%, a difference of 0.19%), Immigrants from Northern Europe (11.6%, a difference of 0.45%), and Croatian (11.6%, a difference of 0.46%).
| Demographics | Rating | Rank | Female Poverty |
| Lithuanians | 99.8 /100 | #14 | Exceptional 11.4% |
| Latvians | 99.8 /100 | #15 | Exceptional 11.4% |
| Immigrants | Bolivia | 99.8 /100 | #16 | Exceptional 11.5% |
| Bolivians | 99.8 /100 | #17 | Exceptional 11.5% |
| Immigrants | Scotland | 99.8 /100 | #18 | Exceptional 11.5% |
| Norwegians | 99.8 /100 | #19 | Exceptional 11.5% |
| Eastern Europeans | 99.7 /100 | #20 | Exceptional 11.5% |
| Italians | 99.7 /100 | #21 | Exceptional 11.6% |
| Swedes | 99.7 /100 | #22 | Exceptional 11.6% |
| Burmese | 99.7 /100 | #23 | Exceptional 11.6% |
| Luxembourgers | 99.7 /100 | #24 | Exceptional 11.6% |
| Immigrants | Northern Europe | 99.6 /100 | #25 | Exceptional 11.6% |
| Croatians | 99.6 /100 | #26 | Exceptional 11.6% |
| Iranians | 99.6 /100 | #27 | Exceptional 11.7% |
| Immigrants | Korea | 99.6 /100 | #28 | Exceptional 11.7% |