Immigrants from Saudi Arabia vs Italian Female Poverty
COMPARE
Immigrants from Saudi Arabia
Italian
Female Poverty
Female Poverty Comparison
Immigrants from Saudi Arabia
Italians
14.8%
FEMALE POVERTY
1.4/ 100
METRIC RATING
233rd/ 347
METRIC RANK
11.6%
FEMALE POVERTY
99.7/ 100
METRIC RATING
21st/ 347
METRIC RANK
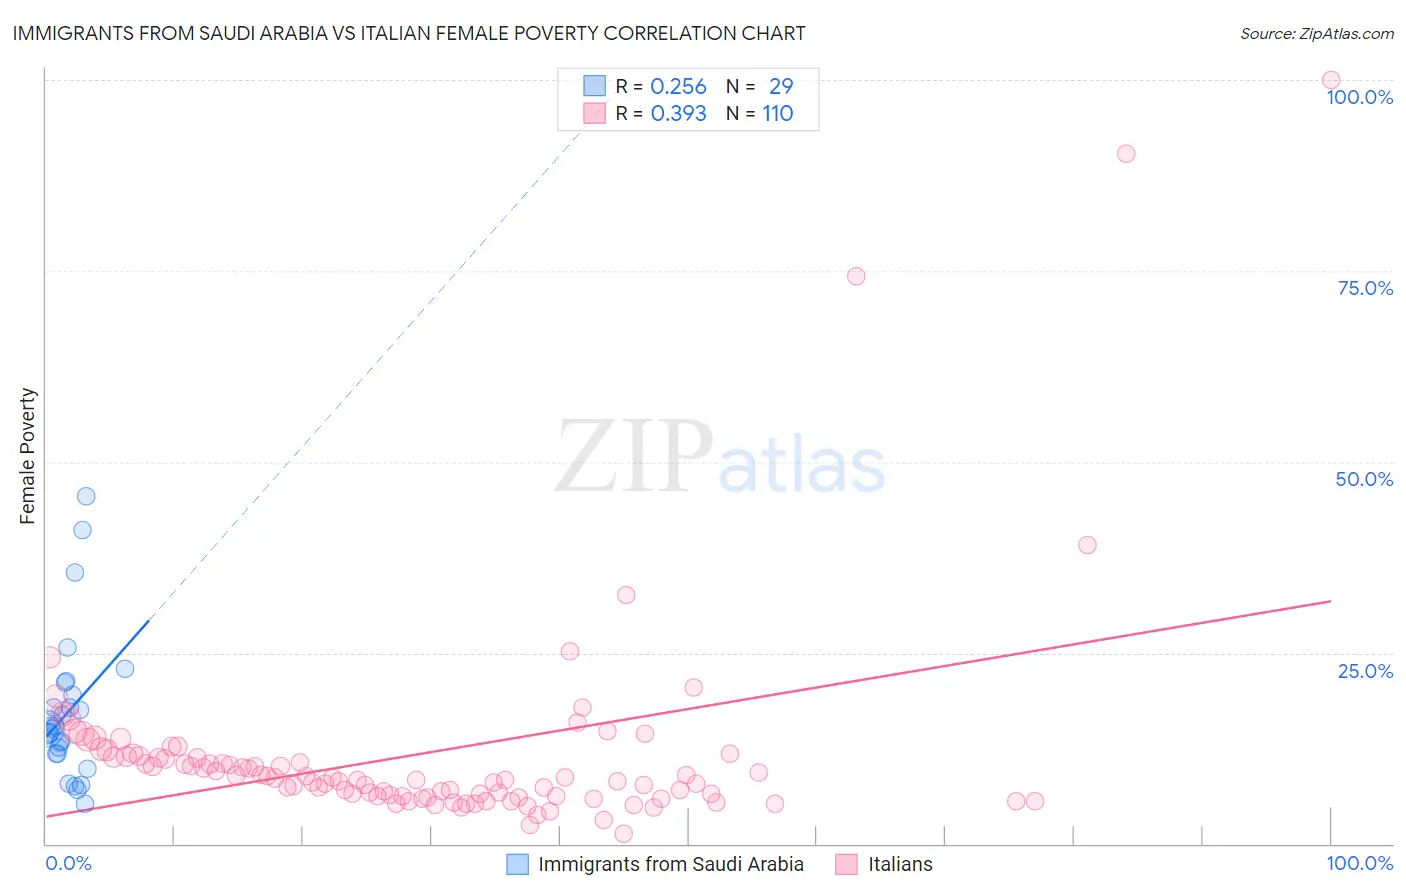
Immigrants from Saudi Arabia vs Italian Female Poverty Correlation Chart
The statistical analysis conducted on geographies consisting of 164,202,367 people shows a weak positive correlation between the proportion of Immigrants from Saudi Arabia and poverty level among females in the United States with a correlation coefficient (R) of 0.256 and weighted average of 14.8%. Similarly, the statistical analysis conducted on geographies consisting of 573,632,055 people shows a mild positive correlation between the proportion of Italians and poverty level among females in the United States with a correlation coefficient (R) of 0.393 and weighted average of 11.6%, a difference of 27.9%.
Female Poverty Correlation Summary
| Measurement | Immigrants from Saudi Arabia | Italian |
| Minimum | 5.3% | 1.3% |
| Maximum | 45.5% | 100.0% |
| Range | 40.2% | 98.7% |
| Mean | 17.3% | 11.8% |
| Median | 15.1% | 8.5% |
| Interquartile 25% (IQ1) | 11.8% | 6.3% |
| Interquartile 75% (IQ3) | 20.2% | 11.4% |
| Interquartile Range (IQR) | 8.4% | 5.1% |
| Standard Deviation (Sample) | 9.6% | 14.1% |
| Standard Deviation (Population) | 9.4% | 14.0% |
Similar Demographics by Female Poverty
Demographics Similar to Immigrants from Saudi Arabia by Female Poverty
In terms of female poverty, the demographic groups most similar to Immigrants from Saudi Arabia are Osage (14.8%, a difference of 0.10%), Nigerian (14.8%, a difference of 0.41%), Alaska Native (14.7%, a difference of 0.51%), Fijian (14.9%, a difference of 0.52%), and Ghanaian (14.7%, a difference of 0.71%).
| Demographics | Rating | Rank | Female Poverty |
| Immigrants | Eritrea | 2.4 /100 | #226 | Tragic 14.6% |
| Immigrants | Nigeria | 2.1 /100 | #227 | Tragic 14.7% |
| German Russians | 2.0 /100 | #228 | Tragic 14.7% |
| Ghanaians | 1.9 /100 | #229 | Tragic 14.7% |
| Alaska Natives | 1.8 /100 | #230 | Tragic 14.7% |
| Nigerians | 1.7 /100 | #231 | Tragic 14.8% |
| Osage | 1.5 /100 | #232 | Tragic 14.8% |
| Immigrants | Saudi Arabia | 1.4 /100 | #233 | Tragic 14.8% |
| Fijians | 1.1 /100 | #234 | Tragic 14.9% |
| Immigrants | Laos | 0.9 /100 | #235 | Tragic 15.0% |
| Cree | 0.7 /100 | #236 | Tragic 15.1% |
| French American Indians | 0.6 /100 | #237 | Tragic 15.1% |
| Immigrants | Armenia | 0.6 /100 | #238 | Tragic 15.1% |
| Immigrants | Middle Africa | 0.5 /100 | #239 | Tragic 15.2% |
| Sudanese | 0.5 /100 | #240 | Tragic 15.2% |
Demographics Similar to Italians by Female Poverty
In terms of female poverty, the demographic groups most similar to Italians are Swedish (11.6%, a difference of 0.030%), Burmese (11.6%, a difference of 0.17%), Luxembourger (11.6%, a difference of 0.19%), Immigrants from Northern Europe (11.6%, a difference of 0.45%), and Croatian (11.6%, a difference of 0.46%).
| Demographics | Rating | Rank | Female Poverty |
| Lithuanians | 99.8 /100 | #14 | Exceptional 11.4% |
| Latvians | 99.8 /100 | #15 | Exceptional 11.4% |
| Immigrants | Bolivia | 99.8 /100 | #16 | Exceptional 11.5% |
| Bolivians | 99.8 /100 | #17 | Exceptional 11.5% |
| Immigrants | Scotland | 99.8 /100 | #18 | Exceptional 11.5% |
| Norwegians | 99.8 /100 | #19 | Exceptional 11.5% |
| Eastern Europeans | 99.7 /100 | #20 | Exceptional 11.5% |
| Italians | 99.7 /100 | #21 | Exceptional 11.6% |
| Swedes | 99.7 /100 | #22 | Exceptional 11.6% |
| Burmese | 99.7 /100 | #23 | Exceptional 11.6% |
| Luxembourgers | 99.7 /100 | #24 | Exceptional 11.6% |
| Immigrants | Northern Europe | 99.6 /100 | #25 | Exceptional 11.6% |
| Croatians | 99.6 /100 | #26 | Exceptional 11.6% |
| Iranians | 99.6 /100 | #27 | Exceptional 11.7% |
| Immigrants | Korea | 99.6 /100 | #28 | Exceptional 11.7% |