Immigrants from Eastern Europe vs Italian Female Poverty
COMPARE
Immigrants from Eastern Europe
Italian
Female Poverty
Female Poverty Comparison
Immigrants from Eastern Europe
Italians
12.3%
FEMALE POVERTY
97.2/ 100
METRIC RATING
76th/ 347
METRIC RANK
11.6%
FEMALE POVERTY
99.7/ 100
METRIC RATING
21st/ 347
METRIC RANK
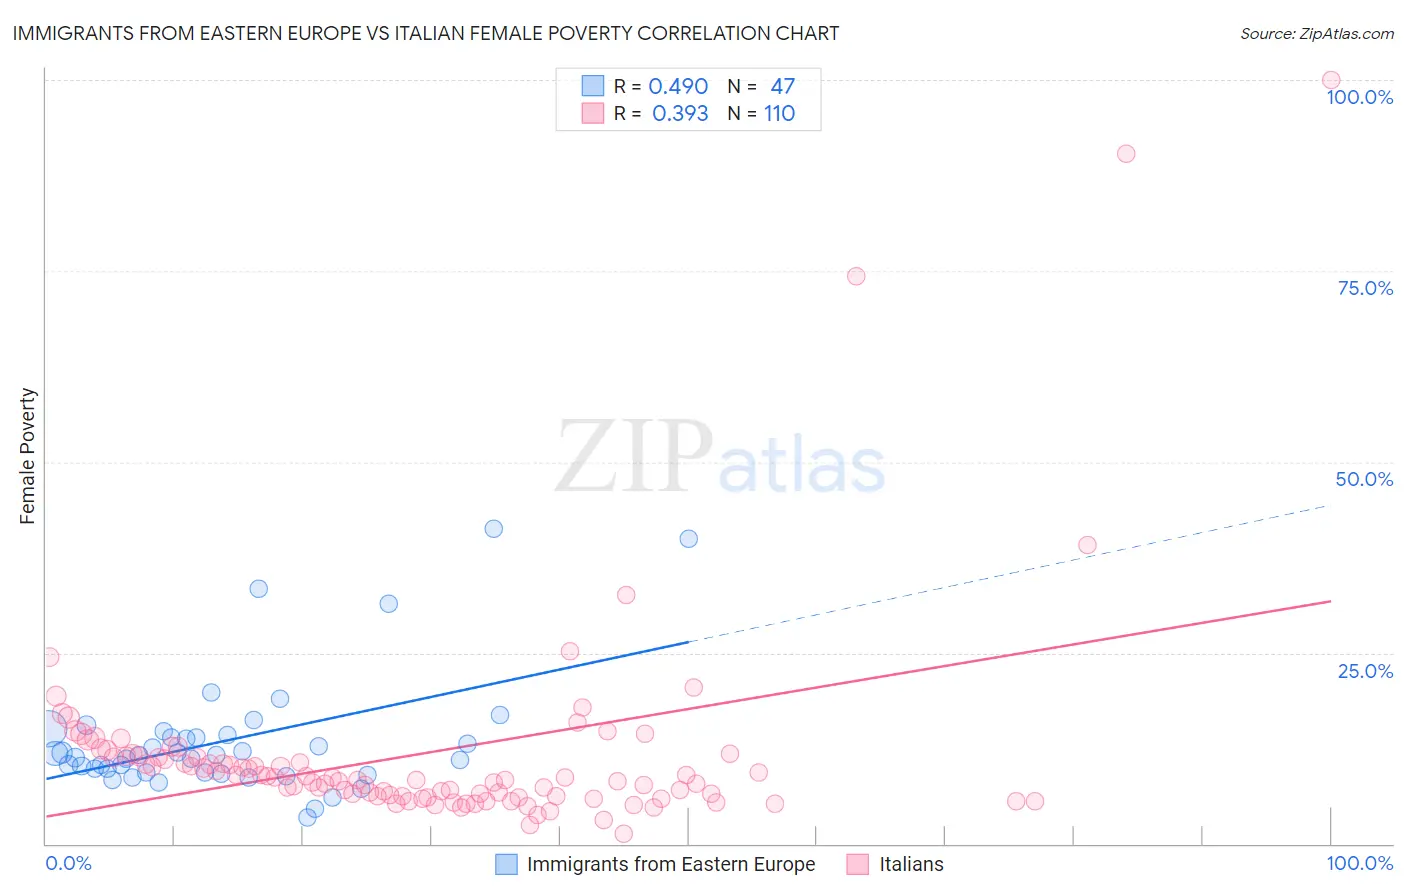
Immigrants from Eastern Europe vs Italian Female Poverty Correlation Chart
The statistical analysis conducted on geographies consisting of 475,295,788 people shows a moderate positive correlation between the proportion of Immigrants from Eastern Europe and poverty level among females in the United States with a correlation coefficient (R) of 0.490 and weighted average of 12.3%. Similarly, the statistical analysis conducted on geographies consisting of 573,632,055 people shows a mild positive correlation between the proportion of Italians and poverty level among females in the United States with a correlation coefficient (R) of 0.393 and weighted average of 11.6%, a difference of 6.1%.
Female Poverty Correlation Summary
| Measurement | Immigrants from Eastern Europe | Italian |
| Minimum | 3.4% | 1.3% |
| Maximum | 41.3% | 100.0% |
| Range | 37.9% | 98.7% |
| Mean | 13.5% | 11.8% |
| Median | 11.6% | 8.5% |
| Interquartile 25% (IQ1) | 9.3% | 6.3% |
| Interquartile 75% (IQ3) | 14.3% | 11.4% |
| Interquartile Range (IQR) | 5.0% | 5.1% |
| Standard Deviation (Sample) | 7.9% | 14.1% |
| Standard Deviation (Population) | 7.8% | 14.0% |
Similar Demographics by Female Poverty
Demographics Similar to Immigrants from Eastern Europe by Female Poverty
In terms of female poverty, the demographic groups most similar to Immigrants from Eastern Europe are Serbian (12.3%, a difference of 0.030%), Egyptian (12.3%, a difference of 0.040%), Immigrants from North America (12.3%, a difference of 0.11%), Slovak (12.3%, a difference of 0.16%), and Immigrants from Sweden (12.3%, a difference of 0.16%).
| Demographics | Rating | Rank | Female Poverty |
| Swiss | 97.7 /100 | #69 | Exceptional 12.2% |
| Immigrants | Belgium | 97.7 /100 | #70 | Exceptional 12.2% |
| Carpatho Rusyns | 97.6 /100 | #71 | Exceptional 12.2% |
| Cambodians | 97.5 /100 | #72 | Exceptional 12.2% |
| Zimbabweans | 97.5 /100 | #73 | Exceptional 12.3% |
| Immigrants | Canada | 97.5 /100 | #74 | Exceptional 12.3% |
| Europeans | 97.4 /100 | #75 | Exceptional 12.3% |
| Immigrants | Eastern Europe | 97.2 /100 | #76 | Exceptional 12.3% |
| Serbians | 97.2 /100 | #77 | Exceptional 12.3% |
| Egyptians | 97.2 /100 | #78 | Exceptional 12.3% |
| Immigrants | North America | 97.1 /100 | #79 | Exceptional 12.3% |
| Slovaks | 97.1 /100 | #80 | Exceptional 12.3% |
| Immigrants | Sweden | 97.1 /100 | #81 | Exceptional 12.3% |
| Jordanians | 97.1 /100 | #82 | Exceptional 12.3% |
| Immigrants | England | 96.9 /100 | #83 | Exceptional 12.3% |
Demographics Similar to Italians by Female Poverty
In terms of female poverty, the demographic groups most similar to Italians are Swedish (11.6%, a difference of 0.030%), Burmese (11.6%, a difference of 0.17%), Luxembourger (11.6%, a difference of 0.19%), Immigrants from Northern Europe (11.6%, a difference of 0.45%), and Croatian (11.6%, a difference of 0.46%).
| Demographics | Rating | Rank | Female Poverty |
| Lithuanians | 99.8 /100 | #14 | Exceptional 11.4% |
| Latvians | 99.8 /100 | #15 | Exceptional 11.4% |
| Immigrants | Bolivia | 99.8 /100 | #16 | Exceptional 11.5% |
| Bolivians | 99.8 /100 | #17 | Exceptional 11.5% |
| Immigrants | Scotland | 99.8 /100 | #18 | Exceptional 11.5% |
| Norwegians | 99.8 /100 | #19 | Exceptional 11.5% |
| Eastern Europeans | 99.7 /100 | #20 | Exceptional 11.5% |
| Italians | 99.7 /100 | #21 | Exceptional 11.6% |
| Swedes | 99.7 /100 | #22 | Exceptional 11.6% |
| Burmese | 99.7 /100 | #23 | Exceptional 11.6% |
| Luxembourgers | 99.7 /100 | #24 | Exceptional 11.6% |
| Immigrants | Northern Europe | 99.6 /100 | #25 | Exceptional 11.6% |
| Croatians | 99.6 /100 | #26 | Exceptional 11.6% |
| Iranians | 99.6 /100 | #27 | Exceptional 11.7% |
| Immigrants | Korea | 99.6 /100 | #28 | Exceptional 11.7% |