Iraqi vs Bermudan Single Female Poverty
COMPARE
Iraqi
Bermudan
Single Female Poverty
Single Female Poverty Comparison
Iraqis
Bermudans
20.8%
SINGLE FEMALE POVERTY
64.5/ 100
METRIC RATING
164th/ 347
METRIC RANK
22.3%
SINGLE FEMALE POVERTY
2.0/ 100
METRIC RATING
242nd/ 347
METRIC RANK
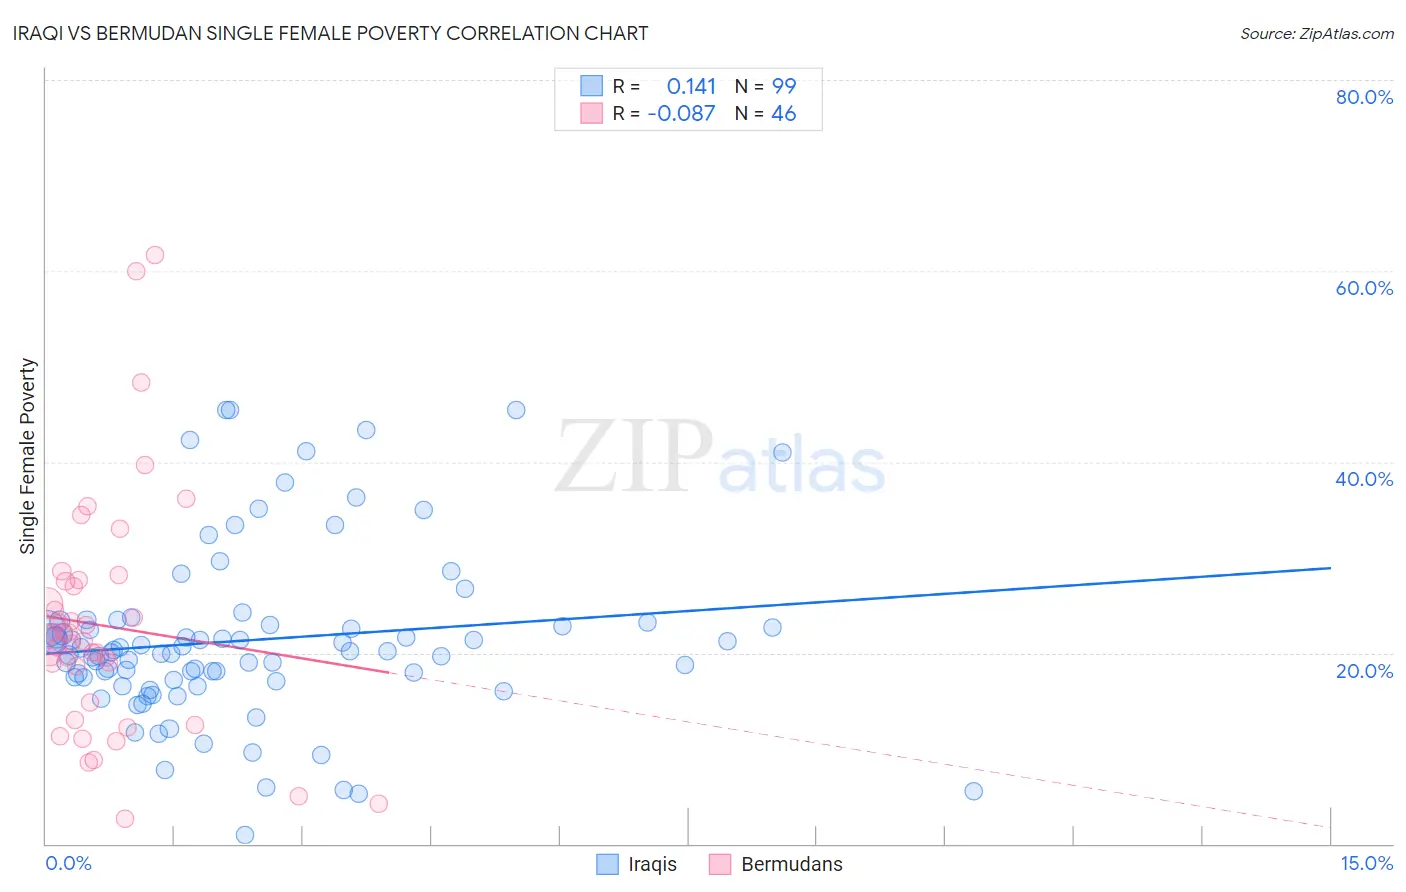
Iraqi vs Bermudan Single Female Poverty Correlation Chart
The statistical analysis conducted on geographies consisting of 169,824,152 people shows a poor positive correlation between the proportion of Iraqis and poverty level among single females in the United States with a correlation coefficient (R) of 0.141 and weighted average of 20.8%. Similarly, the statistical analysis conducted on geographies consisting of 55,621,982 people shows a slight negative correlation between the proportion of Bermudans and poverty level among single females in the United States with a correlation coefficient (R) of -0.087 and weighted average of 22.3%, a difference of 7.0%.
Single Female Poverty Correlation Summary
| Measurement | Iraqi | Bermudan |
| Minimum | 0.98% | 2.6% |
| Maximum | 45.5% | 61.7% |
| Range | 44.5% | 59.1% |
| Mean | 21.3% | 22.9% |
| Median | 20.2% | 21.5% |
| Interquartile 25% (IQ1) | 17.1% | 14.8% |
| Interquartile 75% (IQ3) | 22.9% | 27.4% |
| Interquartile Range (IQR) | 5.7% | 12.7% |
| Standard Deviation (Sample) | 9.0% | 12.4% |
| Standard Deviation (Population) | 8.9% | 12.3% |
Similar Demographics by Single Female Poverty
Demographics Similar to Iraqis by Single Female Poverty
In terms of single female poverty, the demographic groups most similar to Iraqis are Ugandan (20.8%, a difference of 0.040%), Norwegian (20.8%, a difference of 0.10%), Immigrants from Norway (20.8%, a difference of 0.10%), Immigrants from Costa Rica (20.9%, a difference of 0.20%), and Lebanese (20.8%, a difference of 0.22%).
| Demographics | Rating | Rank | Single Female Poverty |
| Immigrants | Oceania | 74.3 /100 | #157 | Good 20.7% |
| Danes | 73.0 /100 | #158 | Good 20.7% |
| Costa Ricans | 71.8 /100 | #159 | Good 20.7% |
| Arabs | 70.8 /100 | #160 | Good 20.7% |
| Kenyans | 68.5 /100 | #161 | Good 20.8% |
| Northern Europeans | 68.4 /100 | #162 | Good 20.8% |
| Lebanese | 67.6 /100 | #163 | Good 20.8% |
| Iraqis | 64.5 /100 | #164 | Good 20.8% |
| Ugandans | 64.0 /100 | #165 | Good 20.8% |
| Norwegians | 63.0 /100 | #166 | Good 20.8% |
| Immigrants | Norway | 63.0 /100 | #167 | Good 20.8% |
| Immigrants | Costa Rica | 61.5 /100 | #168 | Good 20.9% |
| Immigrants | Trinidad and Tobago | 56.3 /100 | #169 | Average 20.9% |
| New Zealanders | 53.2 /100 | #170 | Average 21.0% |
| Moroccans | 52.8 /100 | #171 | Average 21.0% |
Demographics Similar to Bermudans by Single Female Poverty
In terms of single female poverty, the demographic groups most similar to Bermudans are Cape Verdean (22.3%, a difference of 0.070%), West Indian (22.3%, a difference of 0.090%), Immigrants from Middle Africa (22.3%, a difference of 0.10%), Immigrants from Bangladesh (22.3%, a difference of 0.14%), and French (22.2%, a difference of 0.21%).
| Demographics | Rating | Rank | Single Female Poverty |
| Dutch | 4.6 /100 | #235 | Tragic 22.0% |
| Immigrants | Ecuador | 4.2 /100 | #236 | Tragic 22.0% |
| Vietnamese | 4.0 /100 | #237 | Tragic 22.0% |
| French Canadians | 2.8 /100 | #238 | Tragic 22.2% |
| Malaysians | 2.8 /100 | #239 | Tragic 22.2% |
| French | 2.3 /100 | #240 | Tragic 22.2% |
| Cape Verdeans | 2.1 /100 | #241 | Tragic 22.3% |
| Bermudans | 2.0 /100 | #242 | Tragic 22.3% |
| West Indians | 1.9 /100 | #243 | Tragic 22.3% |
| Immigrants | Middle Africa | 1.9 /100 | #244 | Tragic 22.3% |
| Immigrants | Bangladesh | 1.8 /100 | #245 | Tragic 22.3% |
| Liberians | 1.4 /100 | #246 | Tragic 22.4% |
| Immigrants | El Salvador | 1.4 /100 | #247 | Tragic 22.4% |
| Belizeans | 1.4 /100 | #248 | Tragic 22.4% |
| Immigrants | Caribbean | 1.3 /100 | #249 | Tragic 22.4% |