Iraqi vs Pueblo Single Female Poverty
COMPARE
Iraqi
Pueblo
Single Female Poverty
Single Female Poverty Comparison
Iraqis
Pueblo
20.8%
SINGLE FEMALE POVERTY
64.5/ 100
METRIC RATING
164th/ 347
METRIC RANK
28.6%
SINGLE FEMALE POVERTY
0.0/ 100
METRIC RATING
334th/ 347
METRIC RANK
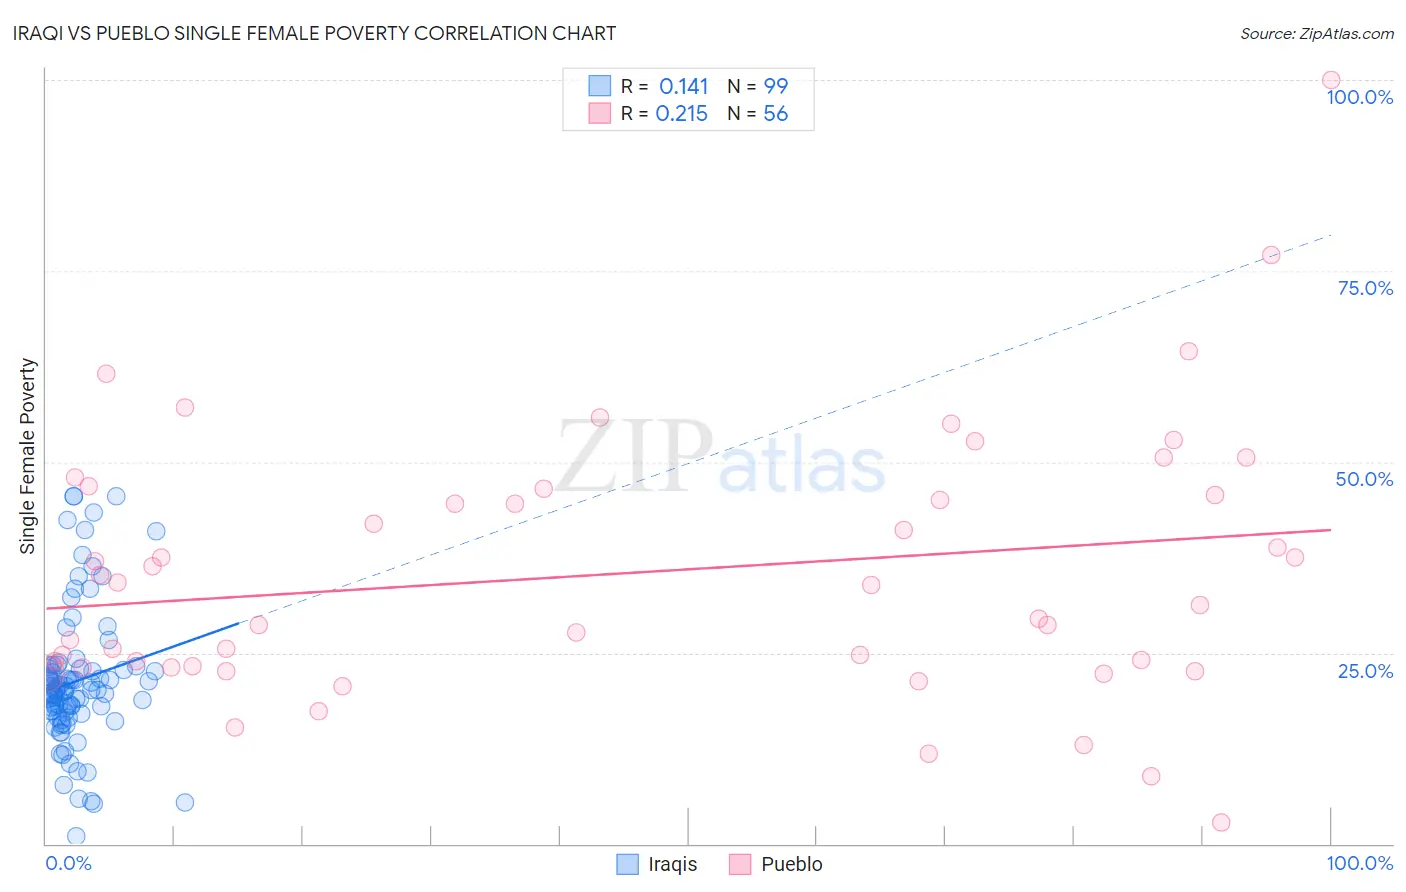
Iraqi vs Pueblo Single Female Poverty Correlation Chart
The statistical analysis conducted on geographies consisting of 169,824,152 people shows a poor positive correlation between the proportion of Iraqis and poverty level among single females in the United States with a correlation coefficient (R) of 0.141 and weighted average of 20.8%. Similarly, the statistical analysis conducted on geographies consisting of 119,546,041 people shows a weak positive correlation between the proportion of Pueblo and poverty level among single females in the United States with a correlation coefficient (R) of 0.215 and weighted average of 28.6%, a difference of 37.5%.
Single Female Poverty Correlation Summary
| Measurement | Iraqi | Pueblo |
| Minimum | 0.98% | 2.9% |
| Maximum | 45.5% | 100.0% |
| Range | 44.5% | 97.1% |
| Mean | 21.3% | 35.5% |
| Median | 20.2% | 32.6% |
| Interquartile 25% (IQ1) | 17.1% | 23.2% |
| Interquartile 75% (IQ3) | 22.9% | 46.1% |
| Interquartile Range (IQR) | 5.7% | 22.9% |
| Standard Deviation (Sample) | 9.0% | 17.5% |
| Standard Deviation (Population) | 8.9% | 17.4% |
Similar Demographics by Single Female Poverty
Demographics Similar to Iraqis by Single Female Poverty
In terms of single female poverty, the demographic groups most similar to Iraqis are Ugandan (20.8%, a difference of 0.040%), Norwegian (20.8%, a difference of 0.10%), Immigrants from Norway (20.8%, a difference of 0.10%), Immigrants from Costa Rica (20.9%, a difference of 0.20%), and Lebanese (20.8%, a difference of 0.22%).
| Demographics | Rating | Rank | Single Female Poverty |
| Immigrants | Oceania | 74.3 /100 | #157 | Good 20.7% |
| Danes | 73.0 /100 | #158 | Good 20.7% |
| Costa Ricans | 71.8 /100 | #159 | Good 20.7% |
| Arabs | 70.8 /100 | #160 | Good 20.7% |
| Kenyans | 68.5 /100 | #161 | Good 20.8% |
| Northern Europeans | 68.4 /100 | #162 | Good 20.8% |
| Lebanese | 67.6 /100 | #163 | Good 20.8% |
| Iraqis | 64.5 /100 | #164 | Good 20.8% |
| Ugandans | 64.0 /100 | #165 | Good 20.8% |
| Norwegians | 63.0 /100 | #166 | Good 20.8% |
| Immigrants | Norway | 63.0 /100 | #167 | Good 20.8% |
| Immigrants | Costa Rica | 61.5 /100 | #168 | Good 20.9% |
| Immigrants | Trinidad and Tobago | 56.3 /100 | #169 | Average 20.9% |
| New Zealanders | 53.2 /100 | #170 | Average 21.0% |
| Moroccans | 52.8 /100 | #171 | Average 21.0% |
Demographics Similar to Pueblo by Single Female Poverty
In terms of single female poverty, the demographic groups most similar to Pueblo are Ute (28.4%, a difference of 0.73%), Immigrants from Yemen (28.9%, a difference of 1.1%), Yakama (28.3%, a difference of 1.1%), Native/Alaskan (28.2%, a difference of 1.4%), and Colville (29.1%, a difference of 1.6%).
| Demographics | Rating | Rank | Single Female Poverty |
| Dutch West Indians | 0.0 /100 | #327 | Tragic 27.5% |
| Apache | 0.0 /100 | #328 | Tragic 27.7% |
| Menominee | 0.0 /100 | #329 | Tragic 27.8% |
| Hopi | 0.0 /100 | #330 | Tragic 28.0% |
| Natives/Alaskans | 0.0 /100 | #331 | Tragic 28.2% |
| Yakama | 0.0 /100 | #332 | Tragic 28.3% |
| Ute | 0.0 /100 | #333 | Tragic 28.4% |
| Pueblo | 0.0 /100 | #334 | Tragic 28.6% |
| Immigrants | Yemen | 0.0 /100 | #335 | Tragic 28.9% |
| Colville | 0.0 /100 | #336 | Tragic 29.1% |
| Yuman | 0.0 /100 | #337 | Tragic 29.4% |
| Pima | 0.0 /100 | #338 | Tragic 30.3% |
| Cheyenne | 0.0 /100 | #339 | Tragic 30.4% |
| Cajuns | 0.0 /100 | #340 | Tragic 30.6% |
| Sioux | 0.0 /100 | #341 | Tragic 31.3% |