Iraqi vs Immigrants from Nigeria Single Female Poverty
COMPARE
Iraqi
Immigrants from Nigeria
Single Female Poverty
Single Female Poverty Comparison
Iraqis
Immigrants from Nigeria
20.8%
SINGLE FEMALE POVERTY
64.5/ 100
METRIC RATING
164th/ 347
METRIC RANK
21.2%
SINGLE FEMALE POVERTY
36.8/ 100
METRIC RATING
187th/ 347
METRIC RANK
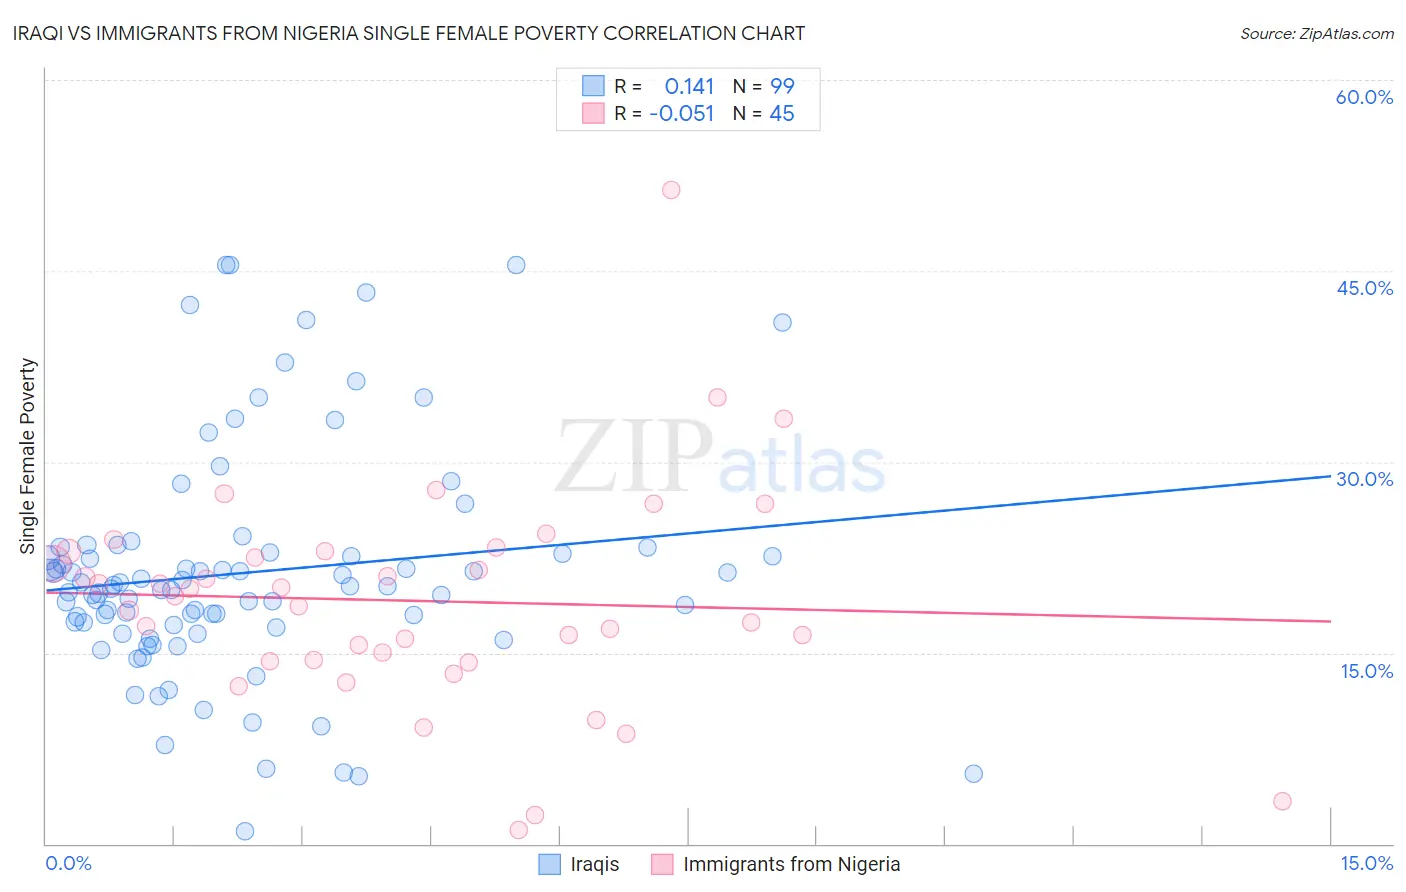
Iraqi vs Immigrants from Nigeria Single Female Poverty Correlation Chart
The statistical analysis conducted on geographies consisting of 169,824,152 people shows a poor positive correlation between the proportion of Iraqis and poverty level among single females in the United States with a correlation coefficient (R) of 0.141 and weighted average of 20.8%. Similarly, the statistical analysis conducted on geographies consisting of 281,424,255 people shows a slight negative correlation between the proportion of Immigrants from Nigeria and poverty level among single females in the United States with a correlation coefficient (R) of -0.051 and weighted average of 21.2%, a difference of 1.8%.
Single Female Poverty Correlation Summary
| Measurement | Iraqi | Immigrants from Nigeria |
| Minimum | 0.98% | 1.1% |
| Maximum | 45.5% | 51.4% |
| Range | 44.5% | 50.2% |
| Mean | 21.3% | 19.1% |
| Median | 20.2% | 19.4% |
| Interquartile 25% (IQ1) | 17.1% | 14.4% |
| Interquartile 75% (IQ3) | 22.9% | 23.0% |
| Interquartile Range (IQR) | 5.7% | 8.6% |
| Standard Deviation (Sample) | 9.0% | 8.7% |
| Standard Deviation (Population) | 8.9% | 8.6% |
Similar Demographics by Single Female Poverty
Demographics Similar to Iraqis by Single Female Poverty
In terms of single female poverty, the demographic groups most similar to Iraqis are Ugandan (20.8%, a difference of 0.040%), Norwegian (20.8%, a difference of 0.10%), Immigrants from Norway (20.8%, a difference of 0.10%), Immigrants from Costa Rica (20.9%, a difference of 0.20%), and Lebanese (20.8%, a difference of 0.22%).
| Demographics | Rating | Rank | Single Female Poverty |
| Immigrants | Oceania | 74.3 /100 | #157 | Good 20.7% |
| Danes | 73.0 /100 | #158 | Good 20.7% |
| Costa Ricans | 71.8 /100 | #159 | Good 20.7% |
| Arabs | 70.8 /100 | #160 | Good 20.7% |
| Kenyans | 68.5 /100 | #161 | Good 20.8% |
| Northern Europeans | 68.4 /100 | #162 | Good 20.8% |
| Lebanese | 67.6 /100 | #163 | Good 20.8% |
| Iraqis | 64.5 /100 | #164 | Good 20.8% |
| Ugandans | 64.0 /100 | #165 | Good 20.8% |
| Norwegians | 63.0 /100 | #166 | Good 20.8% |
| Immigrants | Norway | 63.0 /100 | #167 | Good 20.8% |
| Immigrants | Costa Rica | 61.5 /100 | #168 | Good 20.9% |
| Immigrants | Trinidad and Tobago | 56.3 /100 | #169 | Average 20.9% |
| New Zealanders | 53.2 /100 | #170 | Average 21.0% |
| Moroccans | 52.8 /100 | #171 | Average 21.0% |
Demographics Similar to Immigrants from Nigeria by Single Female Poverty
In terms of single female poverty, the demographic groups most similar to Immigrants from Nigeria are Hawaiian (21.2%, a difference of 0.060%), Yugoslavian (21.2%, a difference of 0.090%), Immigrants from Cambodia (21.2%, a difference of 0.10%), Immigrants from Cuba (21.2%, a difference of 0.10%), and Trinidadian and Tobagonian (21.2%, a difference of 0.10%).
| Demographics | Rating | Rank | Single Female Poverty |
| Spanish American Indians | 42.5 /100 | #180 | Average 21.1% |
| Europeans | 42.3 /100 | #181 | Average 21.1% |
| Slavs | 40.5 /100 | #182 | Average 21.1% |
| Slovaks | 39.7 /100 | #183 | Fair 21.1% |
| Hungarians | 39.6 /100 | #184 | Fair 21.1% |
| Immigrants | Cambodia | 38.2 /100 | #185 | Fair 21.2% |
| Hawaiians | 37.7 /100 | #186 | Fair 21.2% |
| Immigrants | Nigeria | 36.8 /100 | #187 | Fair 21.2% |
| Yugoslavians | 35.4 /100 | #188 | Fair 21.2% |
| Immigrants | Cuba | 35.3 /100 | #189 | Fair 21.2% |
| Trinidadians and Tobagonians | 35.2 /100 | #190 | Fair 21.2% |
| Immigrants | Germany | 31.1 /100 | #191 | Fair 21.3% |
| Immigrants | Jamaica | 30.5 /100 | #192 | Fair 21.3% |
| Basques | 28.1 /100 | #193 | Fair 21.3% |
| Czechoslovakians | 27.7 /100 | #194 | Fair 21.3% |