Cypriot vs Mongolian Family Poverty
COMPARE
Cypriot
Mongolian
Family Poverty
Family Poverty Comparison
Cypriots
Mongolians
7.3%
FAMILY POVERTY
99.6/ 100
METRIC RATING
26th/ 347
METRIC RANK
8.6%
FAMILY POVERTY
80.4/ 100
METRIC RATING
149th/ 347
METRIC RANK
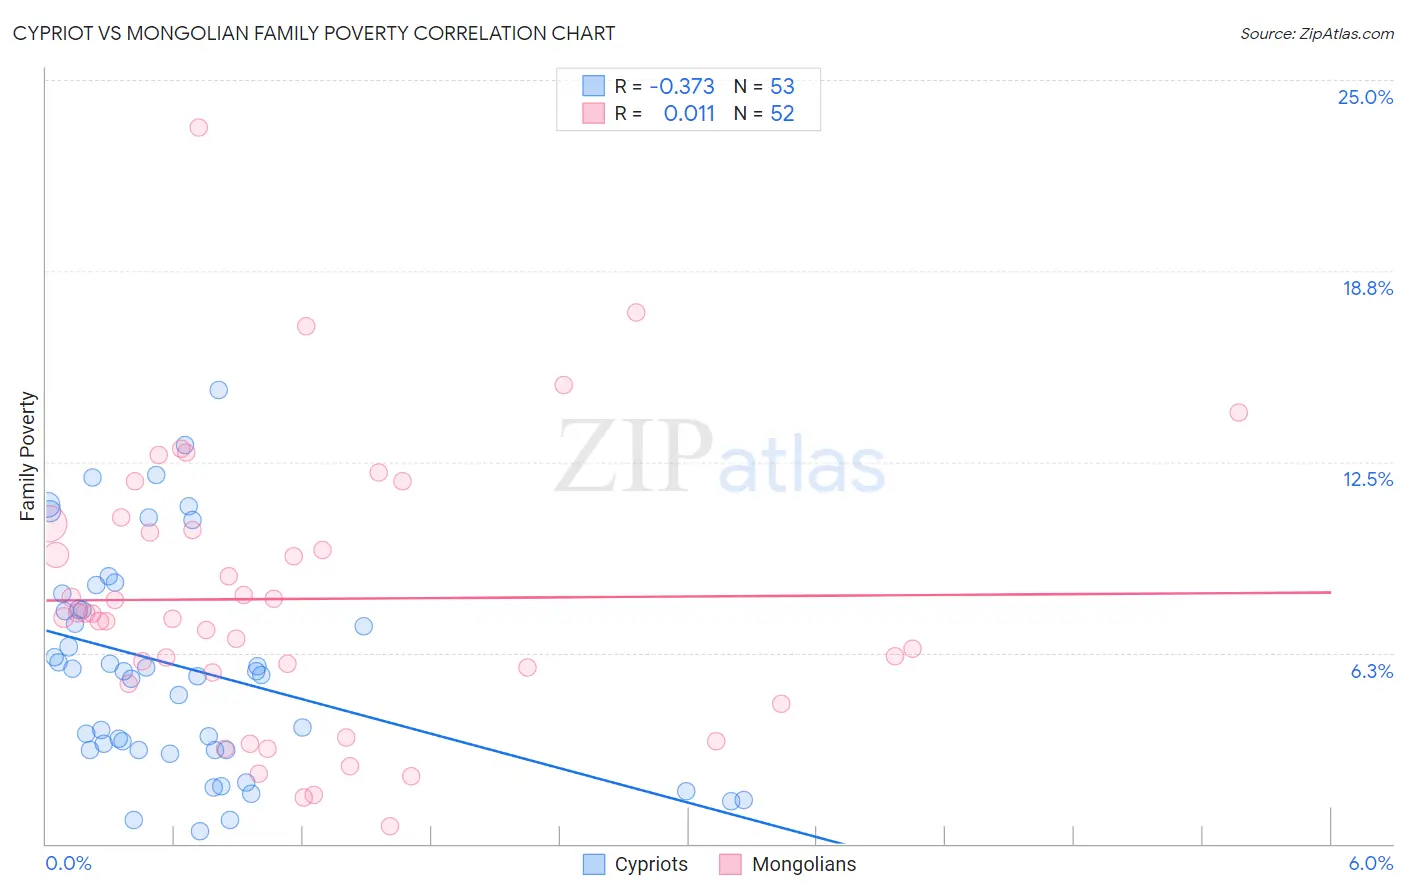
Cypriot vs Mongolian Family Poverty Correlation Chart
The statistical analysis conducted on geographies consisting of 61,784,976 people shows a mild negative correlation between the proportion of Cypriots and poverty level among families in the United States with a correlation coefficient (R) of -0.373 and weighted average of 7.3%. Similarly, the statistical analysis conducted on geographies consisting of 140,209,736 people shows no correlation between the proportion of Mongolians and poverty level among families in the United States with a correlation coefficient (R) of 0.011 and weighted average of 8.6%, a difference of 17.0%.
Family Poverty Correlation Summary
| Measurement | Cypriot | Mongolian |
| Minimum | 0.41% | 0.58% |
| Maximum | 14.8% | 23.4% |
| Range | 14.4% | 22.8% |
| Mean | 5.8% | 8.0% |
| Median | 5.6% | 7.5% |
| Interquartile 25% (IQ1) | 3.1% | 5.4% |
| Interquartile 75% (IQ3) | 7.9% | 10.4% |
| Interquartile Range (IQR) | 4.9% | 4.9% |
| Standard Deviation (Sample) | 3.6% | 4.5% |
| Standard Deviation (Population) | 3.5% | 4.5% |
Similar Demographics by Family Poverty
Demographics Similar to Cypriots by Family Poverty
In terms of family poverty, the demographic groups most similar to Cypriots are Immigrants from Scotland (7.3%, a difference of 0.020%), Burmese (7.3%, a difference of 0.24%), Croatian (7.3%, a difference of 0.25%), Immigrants from Korea (7.4%, a difference of 0.40%), and Assyrian/Chaldean/Syriac (7.3%, a difference of 0.55%).
| Demographics | Rating | Rank | Family Poverty |
| Eastern Europeans | 99.7 /100 | #19 | Exceptional 7.2% |
| Immigrants | Hong Kong | 99.7 /100 | #20 | Exceptional 7.3% |
| Immigrants | Iran | 99.7 /100 | #21 | Exceptional 7.3% |
| Danes | 99.7 /100 | #22 | Exceptional 7.3% |
| Assyrians/Chaldeans/Syriacs | 99.7 /100 | #23 | Exceptional 7.3% |
| Croatians | 99.7 /100 | #24 | Exceptional 7.3% |
| Burmese | 99.7 /100 | #25 | Exceptional 7.3% |
| Cypriots | 99.6 /100 | #26 | Exceptional 7.3% |
| Immigrants | Scotland | 99.6 /100 | #27 | Exceptional 7.3% |
| Immigrants | Korea | 99.6 /100 | #28 | Exceptional 7.4% |
| Immigrants | Northern Europe | 99.6 /100 | #29 | Exceptional 7.4% |
| Italians | 99.6 /100 | #30 | Exceptional 7.4% |
| Czechs | 99.6 /100 | #31 | Exceptional 7.4% |
| Poles | 99.5 /100 | #32 | Exceptional 7.4% |
| Immigrants | Japan | 99.5 /100 | #33 | Exceptional 7.4% |
Demographics Similar to Mongolians by Family Poverty
In terms of family poverty, the demographic groups most similar to Mongolians are Syrian (8.6%, a difference of 0.0%), Brazilian (8.6%, a difference of 0.050%), Samoan (8.6%, a difference of 0.13%), Immigrants from Spain (8.6%, a difference of 0.26%), and Scotch-Irish (8.6%, a difference of 0.41%).
| Demographics | Rating | Rank | Family Poverty |
| Yugoslavians | 83.5 /100 | #142 | Excellent 8.5% |
| Immigrants | Germany | 83.3 /100 | #143 | Excellent 8.5% |
| Albanians | 83.3 /100 | #144 | Excellent 8.5% |
| Immigrants | South Eastern Asia | 83.2 /100 | #145 | Excellent 8.5% |
| Immigrants | Belarus | 83.2 /100 | #146 | Excellent 8.5% |
| Immigrants | Jordan | 83.0 /100 | #147 | Excellent 8.5% |
| Scotch-Irish | 82.2 /100 | #148 | Excellent 8.6% |
| Mongolians | 80.4 /100 | #149 | Excellent 8.6% |
| Syrians | 80.3 /100 | #150 | Excellent 8.6% |
| Brazilians | 80.1 /100 | #151 | Excellent 8.6% |
| Samoans | 79.8 /100 | #152 | Good 8.6% |
| Immigrants | Spain | 79.1 /100 | #153 | Good 8.6% |
| Immigrants | Vietnam | 75.4 /100 | #154 | Good 8.7% |
| Immigrants | Kuwait | 73.6 /100 | #155 | Good 8.7% |
| Immigrants | Oceania | 71.2 /100 | #156 | Good 8.7% |