Spaniard vs Mongolian Family Poverty
COMPARE
Spaniard
Mongolian
Family Poverty
Family Poverty Comparison
Spaniards
Mongolians
9.4%
FAMILY POVERTY
22.8/ 100
METRIC RATING
199th/ 347
METRIC RANK
8.6%
FAMILY POVERTY
80.4/ 100
METRIC RATING
149th/ 347
METRIC RANK
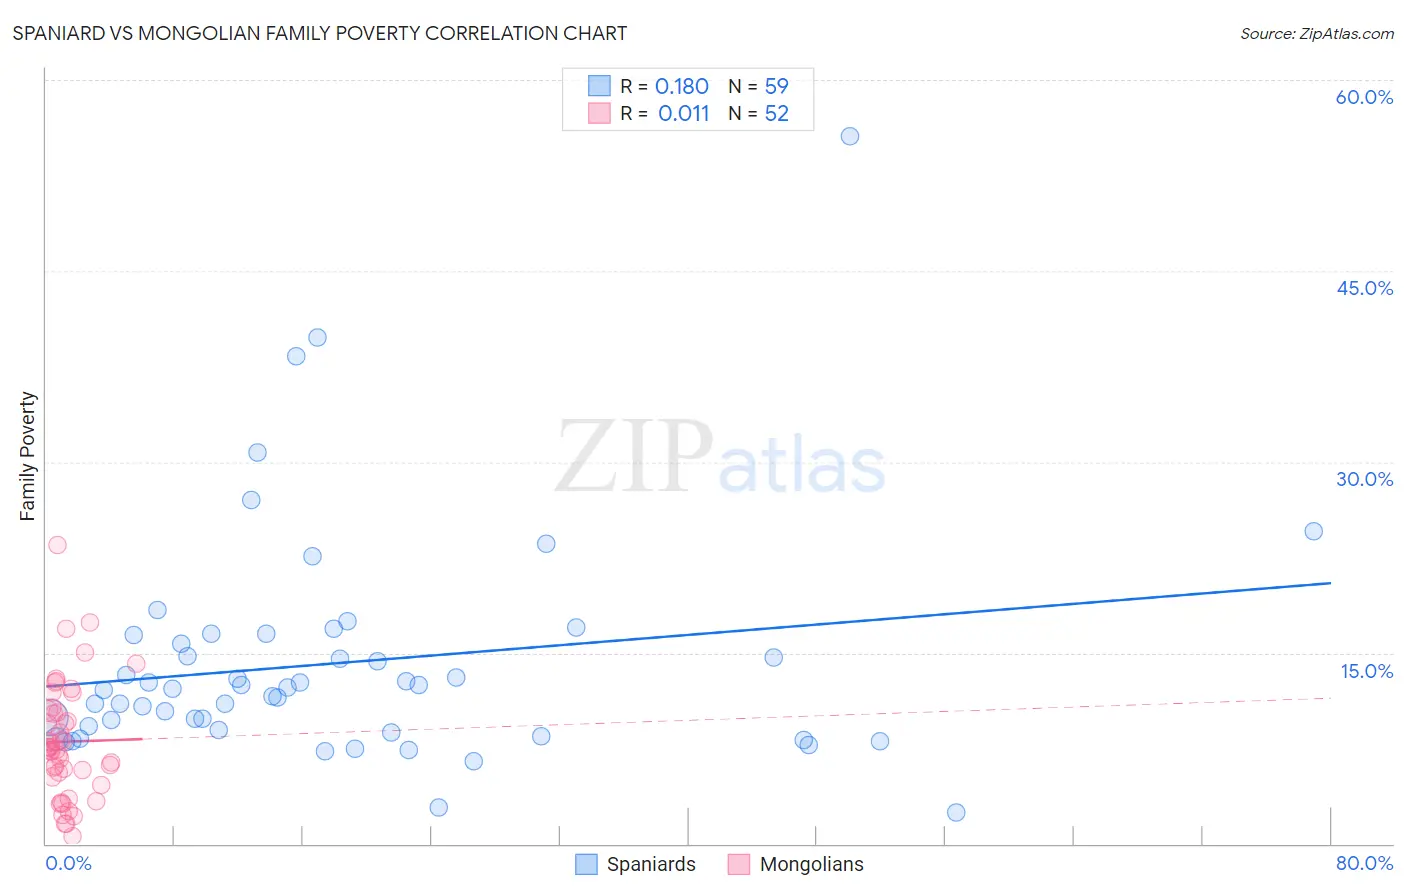
Spaniard vs Mongolian Family Poverty Correlation Chart
The statistical analysis conducted on geographies consisting of 441,991,510 people shows a poor positive correlation between the proportion of Spaniards and poverty level among families in the United States with a correlation coefficient (R) of 0.180 and weighted average of 9.4%. Similarly, the statistical analysis conducted on geographies consisting of 140,209,736 people shows no correlation between the proportion of Mongolians and poverty level among families in the United States with a correlation coefficient (R) of 0.011 and weighted average of 8.6%, a difference of 9.0%.
Family Poverty Correlation Summary
| Measurement | Spaniard | Mongolian |
| Minimum | 2.5% | 0.58% |
| Maximum | 55.6% | 23.4% |
| Range | 53.1% | 22.8% |
| Mean | 14.2% | 8.0% |
| Median | 12.2% | 7.5% |
| Interquartile 25% (IQ1) | 8.7% | 5.4% |
| Interquartile 75% (IQ3) | 16.4% | 10.4% |
| Interquartile Range (IQR) | 7.7% | 4.9% |
| Standard Deviation (Sample) | 9.0% | 4.5% |
| Standard Deviation (Population) | 9.0% | 4.5% |
Similar Demographics by Family Poverty
Demographics Similar to Spaniards by Family Poverty
In terms of family poverty, the demographic groups most similar to Spaniards are Immigrants from Costa Rica (9.4%, a difference of 0.19%), Iraqi (9.3%, a difference of 0.25%), Immigrants from Colombia (9.3%, a difference of 0.28%), Immigrants from Portugal (9.4%, a difference of 0.42%), and Immigrants from Venezuela (9.3%, a difference of 0.57%).
| Demographics | Rating | Rank | Family Poverty |
| Spanish | 28.7 /100 | #192 | Fair 9.3% |
| Immigrants | Western Asia | 28.2 /100 | #193 | Fair 9.3% |
| South Americans | 28.1 /100 | #194 | Fair 9.3% |
| Venezuelans | 27.4 /100 | #195 | Fair 9.3% |
| Immigrants | Venezuela | 26.1 /100 | #196 | Fair 9.3% |
| Immigrants | Colombia | 24.4 /100 | #197 | Fair 9.3% |
| Iraqis | 24.2 /100 | #198 | Fair 9.3% |
| Spaniards | 22.8 /100 | #199 | Fair 9.4% |
| Immigrants | Costa Rica | 21.7 /100 | #200 | Fair 9.4% |
| Immigrants | Portugal | 20.5 /100 | #201 | Fair 9.4% |
| Immigrants | Sierra Leone | 19.6 /100 | #202 | Poor 9.4% |
| German Russians | 19.4 /100 | #203 | Poor 9.4% |
| Immigrants | Lebanon | 18.9 /100 | #204 | Poor 9.4% |
| Aleuts | 18.0 /100 | #205 | Poor 9.5% |
| Immigrants | South America | 18.0 /100 | #206 | Poor 9.5% |
Demographics Similar to Mongolians by Family Poverty
In terms of family poverty, the demographic groups most similar to Mongolians are Syrian (8.6%, a difference of 0.0%), Brazilian (8.6%, a difference of 0.050%), Samoan (8.6%, a difference of 0.13%), Immigrants from Spain (8.6%, a difference of 0.26%), and Scotch-Irish (8.6%, a difference of 0.41%).
| Demographics | Rating | Rank | Family Poverty |
| Yugoslavians | 83.5 /100 | #142 | Excellent 8.5% |
| Immigrants | Germany | 83.3 /100 | #143 | Excellent 8.5% |
| Albanians | 83.3 /100 | #144 | Excellent 8.5% |
| Immigrants | South Eastern Asia | 83.2 /100 | #145 | Excellent 8.5% |
| Immigrants | Belarus | 83.2 /100 | #146 | Excellent 8.5% |
| Immigrants | Jordan | 83.0 /100 | #147 | Excellent 8.5% |
| Scotch-Irish | 82.2 /100 | #148 | Excellent 8.6% |
| Mongolians | 80.4 /100 | #149 | Excellent 8.6% |
| Syrians | 80.3 /100 | #150 | Excellent 8.6% |
| Brazilians | 80.1 /100 | #151 | Excellent 8.6% |
| Samoans | 79.8 /100 | #152 | Good 8.6% |
| Immigrants | Spain | 79.1 /100 | #153 | Good 8.6% |
| Immigrants | Vietnam | 75.4 /100 | #154 | Good 8.7% |
| Immigrants | Kuwait | 73.6 /100 | #155 | Good 8.7% |
| Immigrants | Oceania | 71.2 /100 | #156 | Good 8.7% |