Aleut vs Mongolian Family Poverty
COMPARE
Aleut
Mongolian
Family Poverty
Family Poverty Comparison
Aleuts
Mongolians
9.5%
FAMILY POVERTY
18.0/ 100
METRIC RATING
205th/ 347
METRIC RANK
8.6%
FAMILY POVERTY
80.4/ 100
METRIC RATING
149th/ 347
METRIC RANK
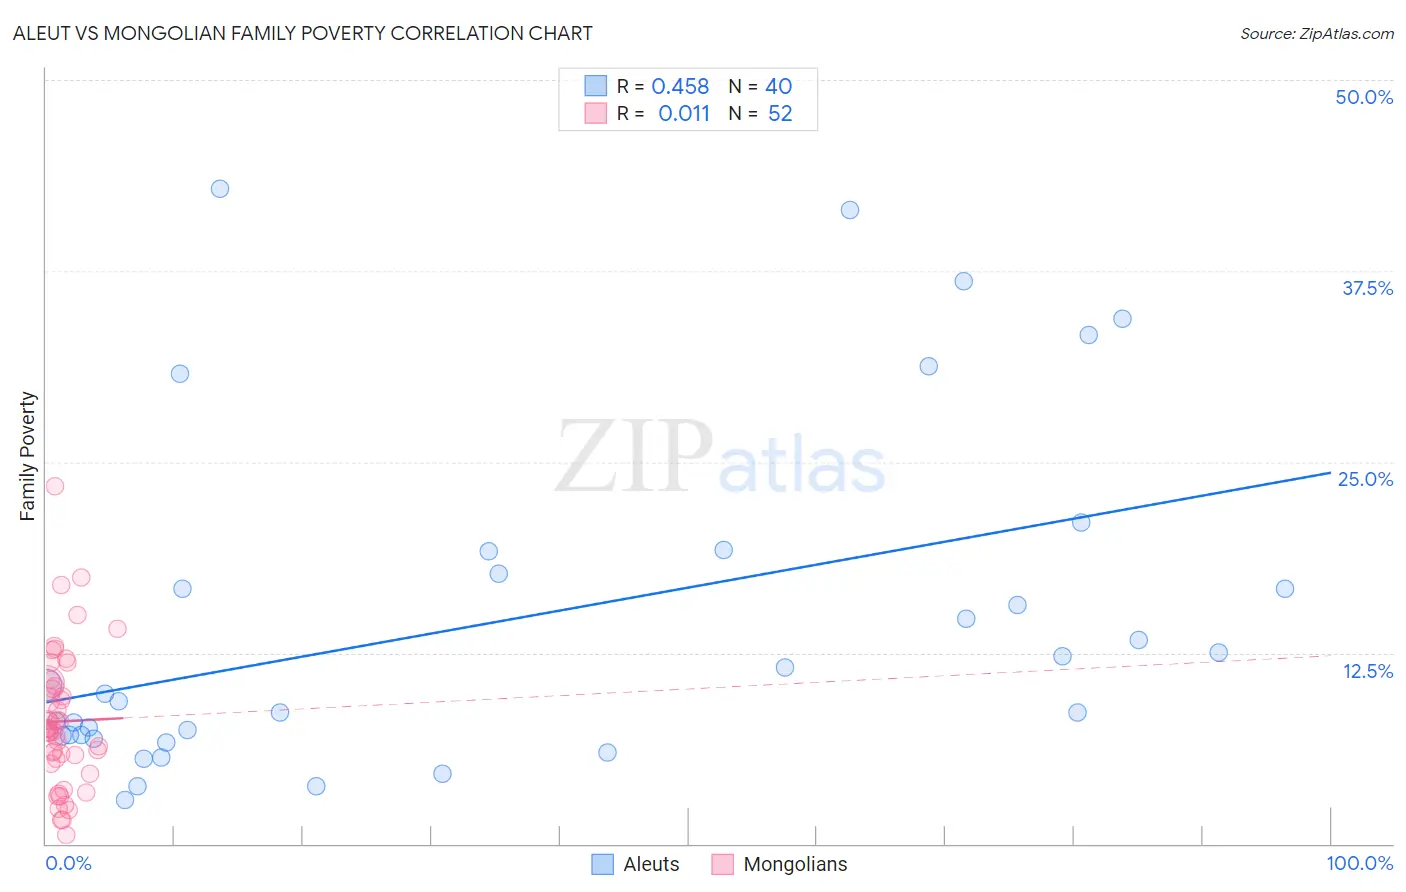
Aleut vs Mongolian Family Poverty Correlation Chart
The statistical analysis conducted on geographies consisting of 61,739,595 people shows a moderate positive correlation between the proportion of Aleuts and poverty level among families in the United States with a correlation coefficient (R) of 0.458 and weighted average of 9.5%. Similarly, the statistical analysis conducted on geographies consisting of 140,209,736 people shows no correlation between the proportion of Mongolians and poverty level among families in the United States with a correlation coefficient (R) of 0.011 and weighted average of 8.6%, a difference of 10.0%.
Family Poverty Correlation Summary
| Measurement | Aleut | Mongolian |
| Minimum | 2.9% | 0.58% |
| Maximum | 42.9% | 23.4% |
| Range | 40.0% | 22.8% |
| Mean | 14.6% | 8.0% |
| Median | 10.1% | 7.5% |
| Interquartile 25% (IQ1) | 7.1% | 5.4% |
| Interquartile 75% (IQ3) | 18.4% | 10.4% |
| Interquartile Range (IQR) | 11.3% | 4.9% |
| Standard Deviation (Sample) | 11.0% | 4.5% |
| Standard Deviation (Population) | 10.9% | 4.5% |
Similar Demographics by Family Poverty
Demographics Similar to Aleuts by Family Poverty
In terms of family poverty, the demographic groups most similar to Aleuts are Immigrants from South America (9.5%, a difference of 0.010%), Immigrants from Lebanon (9.4%, a difference of 0.19%), German Russian (9.4%, a difference of 0.29%), Immigrants from Sierra Leone (9.4%, a difference of 0.33%), and Immigrants from Portugal (9.4%, a difference of 0.51%).
| Demographics | Rating | Rank | Family Poverty |
| Iraqis | 24.2 /100 | #198 | Fair 9.3% |
| Spaniards | 22.8 /100 | #199 | Fair 9.4% |
| Immigrants | Costa Rica | 21.7 /100 | #200 | Fair 9.4% |
| Immigrants | Portugal | 20.5 /100 | #201 | Fair 9.4% |
| Immigrants | Sierra Leone | 19.6 /100 | #202 | Poor 9.4% |
| German Russians | 19.4 /100 | #203 | Poor 9.4% |
| Immigrants | Lebanon | 18.9 /100 | #204 | Poor 9.4% |
| Aleuts | 18.0 /100 | #205 | Poor 9.5% |
| Immigrants | South America | 18.0 /100 | #206 | Poor 9.5% |
| Sierra Leoneans | 15.6 /100 | #207 | Poor 9.5% |
| Immigrants | Eastern Africa | 15.1 /100 | #208 | Poor 9.5% |
| Immigrants | Uruguay | 14.0 /100 | #209 | Poor 9.5% |
| Alsatians | 11.3 /100 | #210 | Poor 9.6% |
| Malaysians | 10.6 /100 | #211 | Poor 9.6% |
| Immigrants | Thailand | 9.7 /100 | #212 | Tragic 9.7% |
Demographics Similar to Mongolians by Family Poverty
In terms of family poverty, the demographic groups most similar to Mongolians are Syrian (8.6%, a difference of 0.0%), Brazilian (8.6%, a difference of 0.050%), Samoan (8.6%, a difference of 0.13%), Immigrants from Spain (8.6%, a difference of 0.26%), and Scotch-Irish (8.6%, a difference of 0.41%).
| Demographics | Rating | Rank | Family Poverty |
| Yugoslavians | 83.5 /100 | #142 | Excellent 8.5% |
| Immigrants | Germany | 83.3 /100 | #143 | Excellent 8.5% |
| Albanians | 83.3 /100 | #144 | Excellent 8.5% |
| Immigrants | South Eastern Asia | 83.2 /100 | #145 | Excellent 8.5% |
| Immigrants | Belarus | 83.2 /100 | #146 | Excellent 8.5% |
| Immigrants | Jordan | 83.0 /100 | #147 | Excellent 8.5% |
| Scotch-Irish | 82.2 /100 | #148 | Excellent 8.6% |
| Mongolians | 80.4 /100 | #149 | Excellent 8.6% |
| Syrians | 80.3 /100 | #150 | Excellent 8.6% |
| Brazilians | 80.1 /100 | #151 | Excellent 8.6% |
| Samoans | 79.8 /100 | #152 | Good 8.6% |
| Immigrants | Spain | 79.1 /100 | #153 | Good 8.6% |
| Immigrants | Vietnam | 75.4 /100 | #154 | Good 8.7% |
| Immigrants | Kuwait | 73.6 /100 | #155 | Good 8.7% |
| Immigrants | Oceania | 71.2 /100 | #156 | Good 8.7% |