Iranian vs Bahamian Family Poverty
COMPARE
Iranian
Bahamian
Family Poverty
Family Poverty Comparison
Iranians
Bahamians
7.1%
FAMILY POVERTY
99.8/ 100
METRIC RATING
14th/ 347
METRIC RANK
11.7%
FAMILY POVERTY
0.0/ 100
METRIC RATING
301st/ 347
METRIC RANK
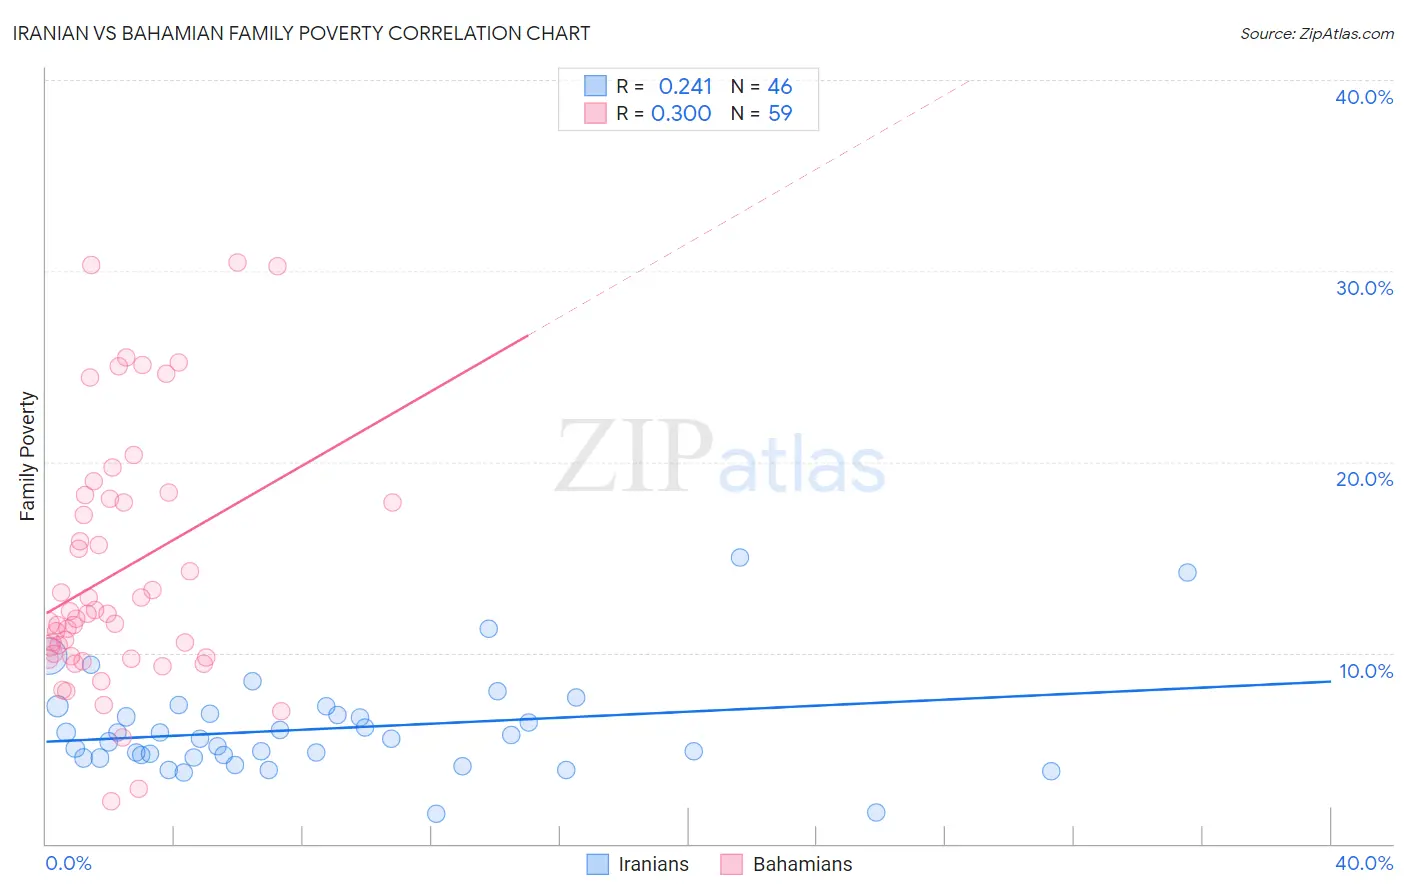
Iranian vs Bahamian Family Poverty Correlation Chart
The statistical analysis conducted on geographies consisting of 316,120,313 people shows a weak positive correlation between the proportion of Iranians and poverty level among families in the United States with a correlation coefficient (R) of 0.241 and weighted average of 7.1%. Similarly, the statistical analysis conducted on geographies consisting of 112,580,407 people shows a weak positive correlation between the proportion of Bahamians and poverty level among families in the United States with a correlation coefficient (R) of 0.300 and weighted average of 11.7%, a difference of 64.4%.
Family Poverty Correlation Summary
| Measurement | Iranian | Bahamian |
| Minimum | 1.6% | 2.2% |
| Maximum | 15.0% | 30.4% |
| Range | 13.4% | 28.2% |
| Mean | 6.0% | 14.2% |
| Median | 5.5% | 12.1% |
| Interquartile 25% (IQ1) | 4.5% | 9.7% |
| Interquartile 75% (IQ3) | 6.8% | 18.1% |
| Interquartile Range (IQR) | 2.3% | 8.3% |
| Standard Deviation (Sample) | 2.6% | 6.6% |
| Standard Deviation (Population) | 2.6% | 6.6% |
Similar Demographics by Family Poverty
Demographics Similar to Iranians by Family Poverty
In terms of family poverty, the demographic groups most similar to Iranians are Swedish (7.1%, a difference of 0.010%), Maltese (7.1%, a difference of 0.060%), Immigrants from Singapore (7.1%, a difference of 0.34%), Bulgarian (7.1%, a difference of 0.36%), and Latvian (7.1%, a difference of 0.61%).
| Demographics | Rating | Rank | Family Poverty |
| Immigrants | Ireland | 99.9 /100 | #7 | Exceptional 7.0% |
| Bhutanese | 99.9 /100 | #8 | Exceptional 7.0% |
| Latvians | 99.9 /100 | #9 | Exceptional 7.1% |
| Bulgarians | 99.8 /100 | #10 | Exceptional 7.1% |
| Immigrants | Singapore | 99.8 /100 | #11 | Exceptional 7.1% |
| Maltese | 99.8 /100 | #12 | Exceptional 7.1% |
| Swedes | 99.8 /100 | #13 | Exceptional 7.1% |
| Iranians | 99.8 /100 | #14 | Exceptional 7.1% |
| Lithuanians | 99.8 /100 | #15 | Exceptional 7.2% |
| Immigrants | South Central Asia | 99.8 /100 | #16 | Exceptional 7.2% |
| Luxembourgers | 99.8 /100 | #17 | Exceptional 7.2% |
| Immigrants | Lithuania | 99.8 /100 | #18 | Exceptional 7.2% |
| Eastern Europeans | 99.7 /100 | #19 | Exceptional 7.2% |
| Immigrants | Hong Kong | 99.7 /100 | #20 | Exceptional 7.3% |
| Immigrants | Iran | 99.7 /100 | #21 | Exceptional 7.3% |
Demographics Similar to Bahamians by Family Poverty
In terms of family poverty, the demographic groups most similar to Bahamians are Guatemalan (11.7%, a difference of 0.040%), Immigrants from Bangladesh (11.7%, a difference of 0.25%), Dutch West Indian (11.7%, a difference of 0.27%), Immigrants from Senegal (11.7%, a difference of 0.36%), and Creek (11.7%, a difference of 0.50%).
| Demographics | Rating | Rank | Family Poverty |
| Immigrants | St. Vincent and the Grenadines | 0.0 /100 | #294 | Tragic 11.6% |
| Immigrants | Haiti | 0.0 /100 | #295 | Tragic 11.6% |
| Choctaw | 0.0 /100 | #296 | Tragic 11.6% |
| Creek | 0.0 /100 | #297 | Tragic 11.7% |
| Immigrants | Senegal | 0.0 /100 | #298 | Tragic 11.7% |
| Dutch West Indians | 0.0 /100 | #299 | Tragic 11.7% |
| Immigrants | Bangladesh | 0.0 /100 | #300 | Tragic 11.7% |
| Bahamians | 0.0 /100 | #301 | Tragic 11.7% |
| Guatemalans | 0.0 /100 | #302 | Tragic 11.7% |
| Africans | 0.0 /100 | #303 | Tragic 11.8% |
| Immigrants | Latin America | 0.0 /100 | #304 | Tragic 11.8% |
| Mexicans | 0.0 /100 | #305 | Tragic 11.8% |
| Cajuns | 0.0 /100 | #306 | Tragic 11.9% |
| Immigrants | Congo | 0.0 /100 | #307 | Tragic 11.9% |
| Seminole | 0.0 /100 | #308 | Tragic 11.9% |