Inupiat vs Spanish American Unemployment Among Ages 55 to 59 years
COMPARE
Inupiat
Spanish American
Unemployment Among Ages 55 to 59 years
Unemployment Among Ages 55 to 59 years Comparison
Inupiat
Spanish Americans
9.0%
UNEMPLOYMENT AMONG AGES 55 TO 59 YEARS
0.0/ 100
METRIC RATING
344th/ 347
METRIC RANK
4.9%
UNEMPLOYMENT AMONG AGES 55 TO 59 YEARS
8.1/ 100
METRIC RATING
216th/ 347
METRIC RANK
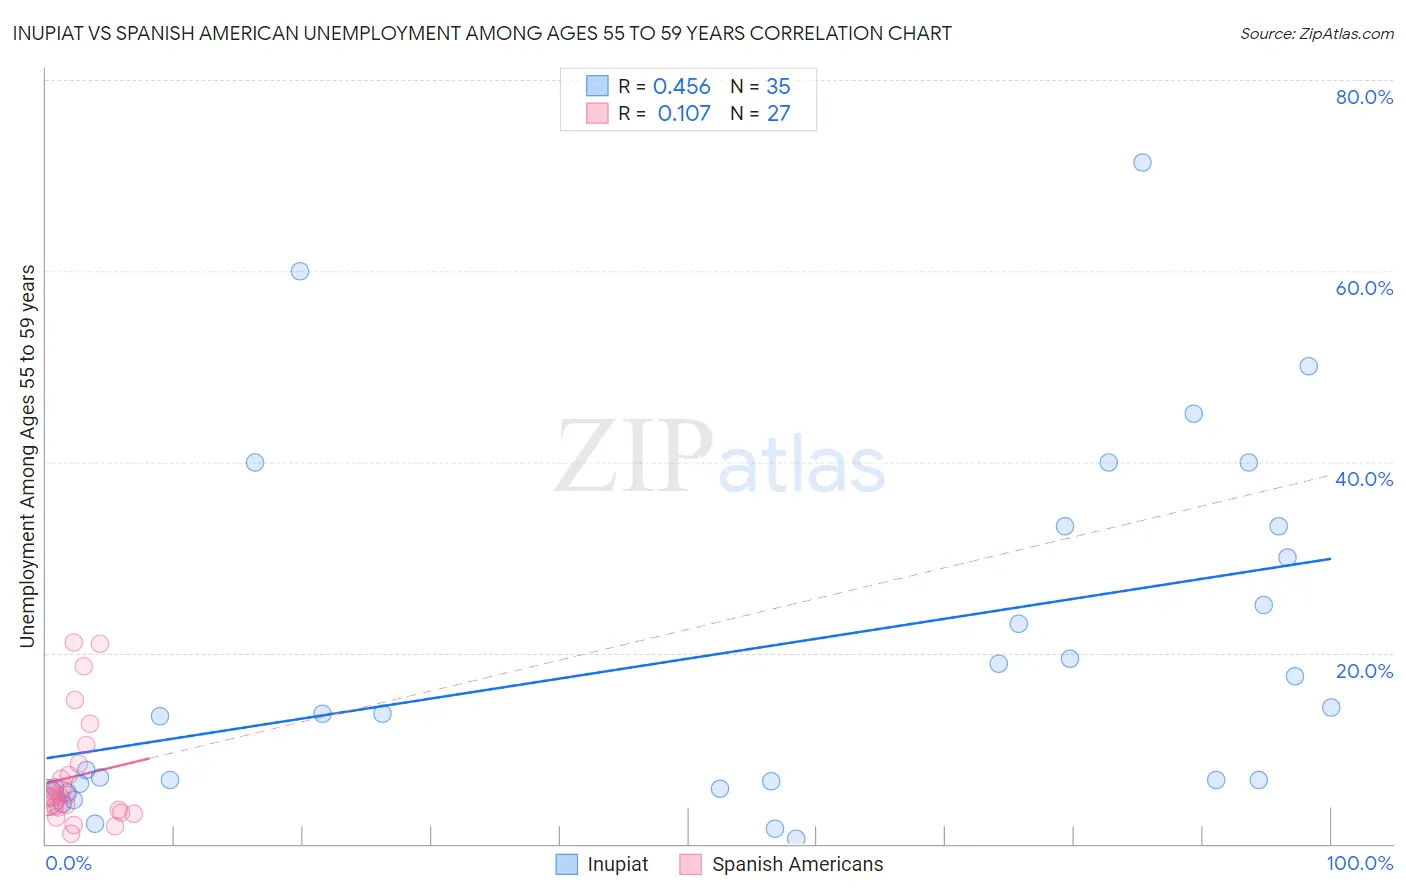
Inupiat vs Spanish American Unemployment Among Ages 55 to 59 years Correlation Chart
The statistical analysis conducted on geographies consisting of 93,729,487 people shows a moderate positive correlation between the proportion of Inupiat and unemployment rate among population between the ages 55 and 59 in the United States with a correlation coefficient (R) of 0.456 and weighted average of 9.0%. Similarly, the statistical analysis conducted on geographies consisting of 100,838,465 people shows a poor positive correlation between the proportion of Spanish Americans and unemployment rate among population between the ages 55 and 59 in the United States with a correlation coefficient (R) of 0.107 and weighted average of 4.9%, a difference of 83.1%.
Unemployment Among Ages 55 to 59 years Correlation Summary
| Measurement | Inupiat | Spanish American |
| Minimum | 0.50% | 1.1% |
| Maximum | 71.4% | 21.1% |
| Range | 70.9% | 20.0% |
| Mean | 19.5% | 7.1% |
| Median | 13.6% | 4.9% |
| Interquartile 25% (IQ1) | 6.0% | 3.5% |
| Interquartile 75% (IQ3) | 33.3% | 8.3% |
| Interquartile Range (IQR) | 27.3% | 4.8% |
| Standard Deviation (Sample) | 18.2% | 5.7% |
| Standard Deviation (Population) | 17.9% | 5.6% |
Similar Demographics by Unemployment Among Ages 55 to 59 years
Demographics Similar to Inupiat by Unemployment Among Ages 55 to 59 years
In terms of unemployment among ages 55 to 59 years, the demographic groups most similar to Inupiat are Yakama (8.9%, a difference of 1.2%), Tohono O'odham (9.3%, a difference of 3.0%), Hopi (8.1%, a difference of 11.3%), Menominee (10.5%, a difference of 16.6%), and Shoshone (7.4%, a difference of 22.6%).
| Demographics | Rating | Rank | Unemployment Among Ages 55 to 59 years |
| Pima | 0.0 /100 | #333 | Tragic 6.6% |
| Pueblo | 0.0 /100 | #334 | Tragic 6.7% |
| Colville | 0.0 /100 | #335 | Tragic 6.7% |
| Navajo | 0.0 /100 | #336 | Tragic 6.7% |
| Paiute | 0.0 /100 | #337 | Tragic 6.8% |
| Immigrants | Yemen | 0.0 /100 | #338 | Tragic 6.9% |
| Puerto Ricans | 0.0 /100 | #339 | Tragic 7.0% |
| Alaskan Athabascans | 0.0 /100 | #340 | Tragic 7.1% |
| Shoshone | 0.0 /100 | #341 | Tragic 7.4% |
| Hopi | 0.0 /100 | #342 | Tragic 8.1% |
| Yakama | 0.0 /100 | #343 | Tragic 8.9% |
| Inupiat | 0.0 /100 | #344 | Tragic 9.0% |
| Tohono O'odham | 0.0 /100 | #345 | Tragic 9.3% |
| Menominee | 0.0 /100 | #346 | Tragic 10.5% |
| Yup'ik | 0.0 /100 | #347 | Tragic 13.9% |
Demographics Similar to Spanish Americans by Unemployment Among Ages 55 to 59 years
In terms of unemployment among ages 55 to 59 years, the demographic groups most similar to Spanish Americans are Immigrants from Brazil (4.9%, a difference of 0.010%), Immigrants from Austria (4.9%, a difference of 0.020%), Immigrants from Nigeria (4.9%, a difference of 0.020%), Syrian (4.9%, a difference of 0.060%), and Indian (Asian) (4.9%, a difference of 0.080%).
| Demographics | Rating | Rank | Unemployment Among Ages 55 to 59 years |
| Immigrants | Haiti | 13.3 /100 | #209 | Poor 4.9% |
| Creek | 12.9 /100 | #210 | Poor 4.9% |
| Hawaiians | 12.8 /100 | #211 | Poor 4.9% |
| Immigrants | Nonimmigrants | 11.2 /100 | #212 | Poor 4.9% |
| Bermudans | 11.0 /100 | #213 | Poor 4.9% |
| Immigrants | Denmark | 10.3 /100 | #214 | Poor 4.9% |
| Syrians | 8.6 /100 | #215 | Tragic 4.9% |
| Spanish Americans | 8.1 /100 | #216 | Tragic 4.9% |
| Immigrants | Brazil | 8.1 /100 | #217 | Tragic 4.9% |
| Immigrants | Austria | 8.0 /100 | #218 | Tragic 4.9% |
| Immigrants | Nigeria | 8.0 /100 | #219 | Tragic 4.9% |
| Indians (Asian) | 7.6 /100 | #220 | Tragic 4.9% |
| Nigerians | 7.5 /100 | #221 | Tragic 4.9% |
| Spanish | 5.1 /100 | #222 | Tragic 5.0% |
| Immigrants | Ireland | 4.8 /100 | #223 | Tragic 5.0% |