Indian (Asian) vs Yakama Seniors Poverty Over the Age of 75
COMPARE
Indian (Asian)
Yakama
Seniors Poverty Over the Age of 75
Seniors Poverty Over the Age of 75 Comparison
Indians (Asian)
Yakama
12.7%
SENIORS POVERTY OVER THE AGE OF 75
9.7/ 100
METRIC RATING
205th/ 347
METRIC RANK
18.3%
SENIORS POVERTY OVER THE AGE OF 75
0.0/ 100
METRIC RATING
337th/ 347
METRIC RANK
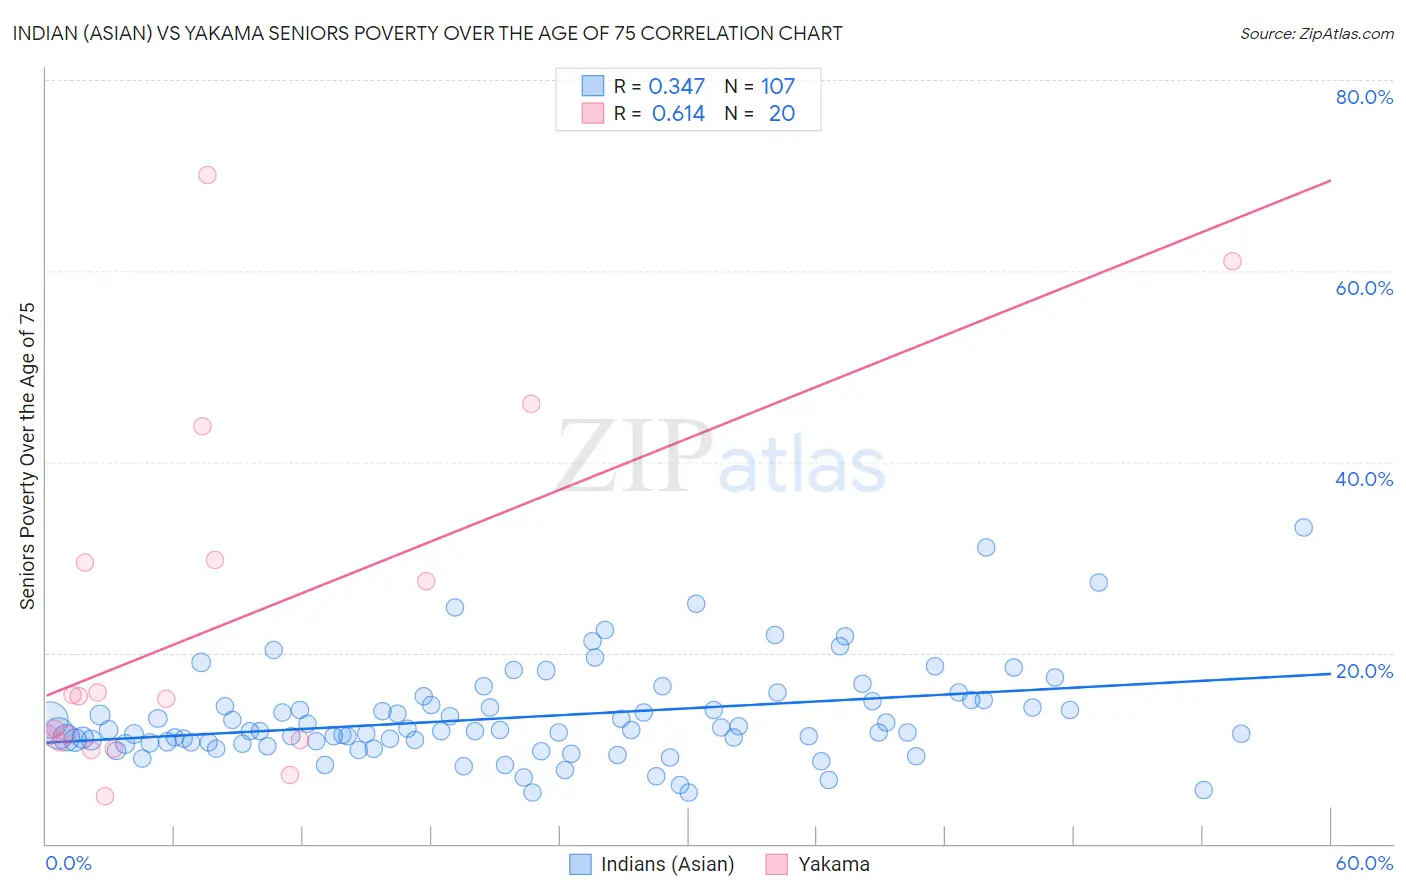
Indian (Asian) vs Yakama Seniors Poverty Over the Age of 75 Correlation Chart
The statistical analysis conducted on geographies consisting of 486,315,330 people shows a mild positive correlation between the proportion of Indians (Asian) and poverty level among seniors over the age of 75 in the United States with a correlation coefficient (R) of 0.347 and weighted average of 12.7%. Similarly, the statistical analysis conducted on geographies consisting of 19,834,385 people shows a significant positive correlation between the proportion of Yakama and poverty level among seniors over the age of 75 in the United States with a correlation coefficient (R) of 0.614 and weighted average of 18.3%, a difference of 43.8%.
Seniors Poverty Over the Age of 75 Correlation Summary
| Measurement | Indian (Asian) | Yakama |
| Minimum | 5.3% | 5.0% |
| Maximum | 33.1% | 70.0% |
| Range | 27.8% | 65.0% |
| Mean | 13.3% | 22.9% |
| Median | 11.8% | 15.3% |
| Interquartile 25% (IQ1) | 10.6% | 10.8% |
| Interquartile 75% (IQ3) | 14.9% | 29.6% |
| Interquartile Range (IQR) | 4.2% | 18.8% |
| Standard Deviation (Sample) | 5.0% | 18.6% |
| Standard Deviation (Population) | 5.0% | 18.1% |
Similar Demographics by Seniors Poverty Over the Age of 75
Demographics Similar to Indians (Asian) by Seniors Poverty Over the Age of 75
In terms of seniors poverty over the age of 75, the demographic groups most similar to Indians (Asian) are Albanian (12.7%, a difference of 0.040%), Immigrants from Eritrea (12.7%, a difference of 0.16%), Immigrants from Southern Europe (12.7%, a difference of 0.19%), Costa Rican (12.8%, a difference of 0.24%), and Arapaho (12.7%, a difference of 0.25%).
| Demographics | Rating | Rank | Seniors Poverty Over the Age of 75 |
| Chileans | 13.7 /100 | #198 | Poor 12.6% |
| Immigrants | Lebanon | 12.7 /100 | #199 | Poor 12.7% |
| Immigrants | Vietnam | 12.1 /100 | #200 | Poor 12.7% |
| Paraguayans | 11.1 /100 | #201 | Poor 12.7% |
| Arapaho | 10.9 /100 | #202 | Poor 12.7% |
| Immigrants | Southern Europe | 10.7 /100 | #203 | Poor 12.7% |
| Immigrants | Eritrea | 10.5 /100 | #204 | Poor 12.7% |
| Indians (Asian) | 9.7 /100 | #205 | Tragic 12.7% |
| Albanians | 9.6 /100 | #206 | Tragic 12.7% |
| Costa Ricans | 8.7 /100 | #207 | Tragic 12.8% |
| Immigrants | Eastern Asia | 8.4 /100 | #208 | Tragic 12.8% |
| Immigrants | Liberia | 7.3 /100 | #209 | Tragic 12.8% |
| Comanche | 7.0 /100 | #210 | Tragic 12.8% |
| Brazilians | 6.9 /100 | #211 | Tragic 12.8% |
| Immigrants | Hong Kong | 6.5 /100 | #212 | Tragic 12.8% |
Demographics Similar to Yakama by Seniors Poverty Over the Age of 75
In terms of seniors poverty over the age of 75, the demographic groups most similar to Yakama are Immigrants from Caribbean (18.2%, a difference of 0.40%), Immigrants from Cabo Verde (18.5%, a difference of 0.97%), Cuban (18.0%, a difference of 2.1%), Immigrants from Grenada (17.8%, a difference of 2.6%), and Hopi (18.9%, a difference of 2.9%).
| Demographics | Rating | Rank | Seniors Poverty Over the Age of 75 |
| British West Indians | 0.0 /100 | #330 | Tragic 17.4% |
| Immigrants | Armenia | 0.0 /100 | #331 | Tragic 17.5% |
| Immigrants | St. Vincent and the Grenadines | 0.0 /100 | #332 | Tragic 17.5% |
| Immigrants | Nicaragua | 0.0 /100 | #333 | Tragic 17.6% |
| Immigrants | Grenada | 0.0 /100 | #334 | Tragic 17.8% |
| Cubans | 0.0 /100 | #335 | Tragic 18.0% |
| Immigrants | Caribbean | 0.0 /100 | #336 | Tragic 18.2% |
| Yakama | 0.0 /100 | #337 | Tragic 18.3% |
| Immigrants | Cabo Verde | 0.0 /100 | #338 | Tragic 18.5% |
| Hopi | 0.0 /100 | #339 | Tragic 18.9% |
| Tohono O'odham | 0.0 /100 | #340 | Tragic 19.1% |
| Navajo | 0.0 /100 | #341 | Tragic 19.4% |
| Dominicans | 0.0 /100 | #342 | Tragic 19.6% |
| Lumbee | 0.0 /100 | #343 | Tragic 19.7% |
| Immigrants | Cuba | 0.0 /100 | #344 | Tragic 19.9% |