Indian (Asian) vs Immigrants from Iraq Family Poverty
COMPARE
Indian (Asian)
Immigrants from Iraq
Family Poverty
Family Poverty Comparison
Indians (Asian)
Immigrants from Iraq
7.7%
FAMILY POVERTY
98.8/ 100
METRIC RATING
52nd/ 347
METRIC RANK
9.1%
FAMILY POVERTY
44.4/ 100
METRIC RATING
179th/ 347
METRIC RANK
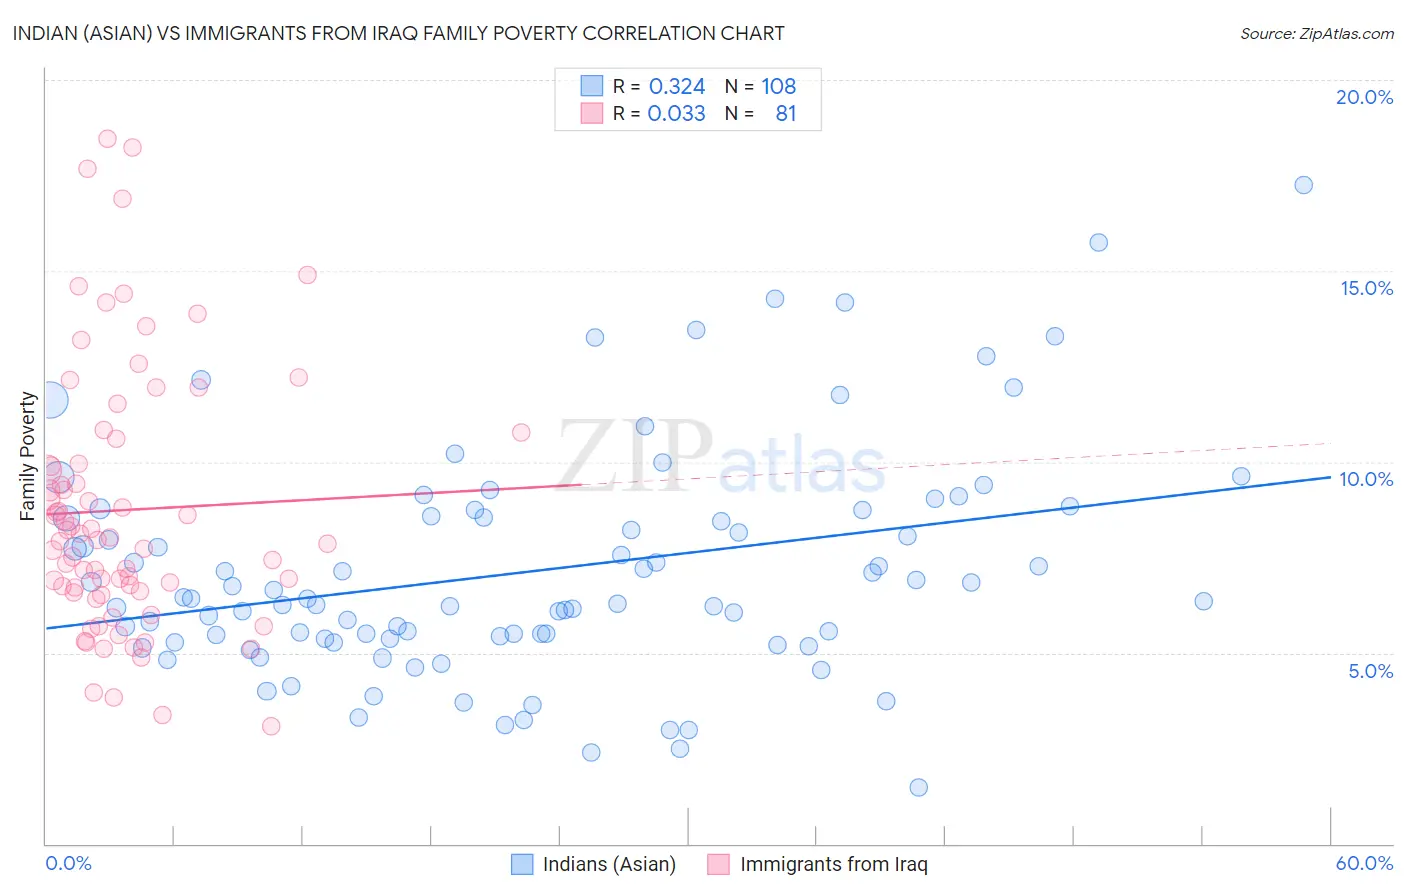
Indian (Asian) vs Immigrants from Iraq Family Poverty Correlation Chart
The statistical analysis conducted on geographies consisting of 492,769,708 people shows a mild positive correlation between the proportion of Indians (Asian) and poverty level among families in the United States with a correlation coefficient (R) of 0.324 and weighted average of 7.7%. Similarly, the statistical analysis conducted on geographies consisting of 194,634,857 people shows no correlation between the proportion of Immigrants from Iraq and poverty level among families in the United States with a correlation coefficient (R) of 0.033 and weighted average of 9.1%, a difference of 17.7%.
Family Poverty Correlation Summary
| Measurement | Indian (Asian) | Immigrants from Iraq |
| Minimum | 1.5% | 3.1% |
| Maximum | 17.3% | 18.5% |
| Range | 15.8% | 15.4% |
| Mean | 7.1% | 8.7% |
| Median | 6.4% | 7.9% |
| Interquartile 25% (IQ1) | 5.4% | 6.6% |
| Interquartile 75% (IQ3) | 8.6% | 10.3% |
| Interquartile Range (IQR) | 3.2% | 3.7% |
| Standard Deviation (Sample) | 3.0% | 3.4% |
| Standard Deviation (Population) | 2.9% | 3.4% |
Similar Demographics by Family Poverty
Demographics Similar to Indians (Asian) by Family Poverty
In terms of family poverty, the demographic groups most similar to Indians (Asian) are Swiss (7.7%, a difference of 0.060%), Immigrants from Sweden (7.7%, a difference of 0.070%), Immigrants from Eastern Asia (7.7%, a difference of 0.10%), Immigrants from Serbia (7.7%, a difference of 0.14%), and Immigrants from Moldova (7.7%, a difference of 0.16%).
| Demographics | Rating | Rank | Family Poverty |
| Okinawans | 98.9 /100 | #45 | Exceptional 7.7% |
| Tongans | 98.9 /100 | #46 | Exceptional 7.7% |
| Immigrants | Czechoslovakia | 98.9 /100 | #47 | Exceptional 7.7% |
| Immigrants | Sri Lanka | 98.9 /100 | #48 | Exceptional 7.7% |
| Immigrants | Bolivia | 98.9 /100 | #49 | Exceptional 7.7% |
| Immigrants | North Macedonia | 98.9 /100 | #50 | Exceptional 7.7% |
| Immigrants | Moldova | 98.8 /100 | #51 | Exceptional 7.7% |
| Indians (Asian) | 98.8 /100 | #52 | Exceptional 7.7% |
| Swiss | 98.8 /100 | #53 | Exceptional 7.7% |
| Immigrants | Sweden | 98.8 /100 | #54 | Exceptional 7.7% |
| Immigrants | Eastern Asia | 98.7 /100 | #55 | Exceptional 7.7% |
| Immigrants | Serbia | 98.7 /100 | #56 | Exceptional 7.7% |
| Asians | 98.7 /100 | #57 | Exceptional 7.7% |
| Finns | 98.7 /100 | #58 | Exceptional 7.7% |
| Europeans | 98.7 /100 | #59 | Exceptional 7.7% |
Demographics Similar to Immigrants from Iraq by Family Poverty
In terms of family poverty, the demographic groups most similar to Immigrants from Iraq are Immigrants from Uganda (9.1%, a difference of 0.13%), Immigrants from Cameroon (9.0%, a difference of 0.36%), Hawaiian (9.0%, a difference of 0.38%), Immigrants from Syria (9.0%, a difference of 0.41%), and Hmong (9.1%, a difference of 0.56%).
| Demographics | Rating | Rank | Family Poverty |
| Immigrants | Peru | 57.5 /100 | #172 | Average 8.9% |
| Immigrants | Fiji | 56.4 /100 | #173 | Average 8.9% |
| Immigrants | Albania | 50.0 /100 | #174 | Average 9.0% |
| Costa Ricans | 49.3 /100 | #175 | Average 9.0% |
| Immigrants | Syria | 47.5 /100 | #176 | Average 9.0% |
| Hawaiians | 47.2 /100 | #177 | Average 9.0% |
| Immigrants | Cameroon | 47.1 /100 | #178 | Average 9.0% |
| Immigrants | Iraq | 44.4 /100 | #179 | Average 9.1% |
| Immigrants | Uganda | 43.4 /100 | #180 | Average 9.1% |
| Hmong | 40.2 /100 | #181 | Average 9.1% |
| Immigrants | Morocco | 40.2 /100 | #182 | Average 9.1% |
| Uruguayans | 39.2 /100 | #183 | Fair 9.1% |
| South American Indians | 38.7 /100 | #184 | Fair 9.1% |
| Immigrants | Saudi Arabia | 38.6 /100 | #185 | Fair 9.1% |
| Colombians | 36.1 /100 | #186 | Fair 9.2% |