Immigrants vs Ugandan Family Poverty
COMPARE
Immigrants
Ugandan
Family Poverty
Family Poverty Comparison
Immigrants
Ugandans
10.0%
FAMILY POVERTY
3.6/ 100
METRIC RATING
225th/ 347
METRIC RANK
9.3%
FAMILY POVERTY
28.7/ 100
METRIC RATING
191st/ 347
METRIC RANK
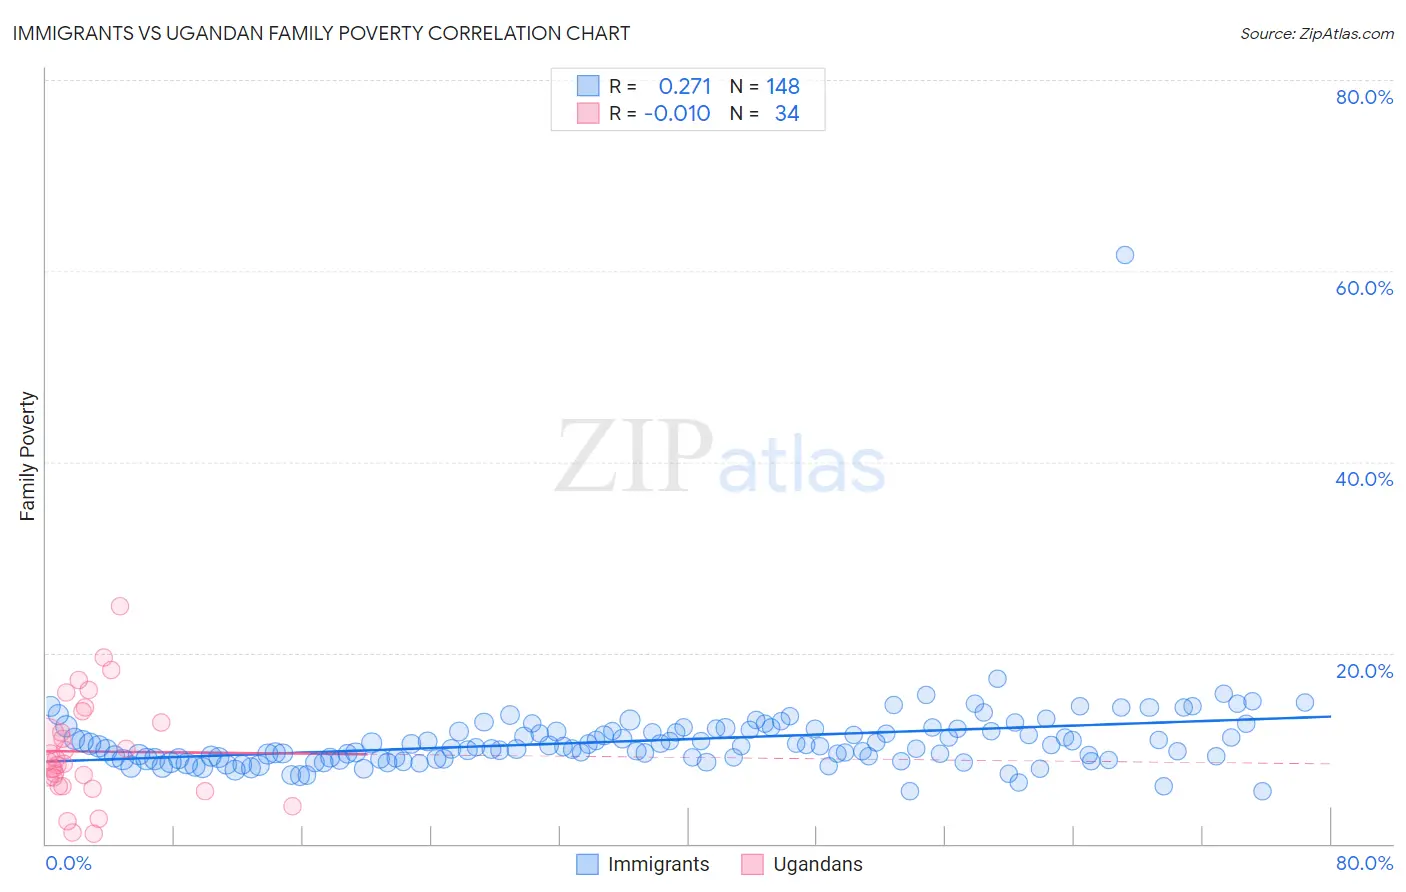
Immigrants vs Ugandan Family Poverty Correlation Chart
The statistical analysis conducted on geographies consisting of 572,663,107 people shows a weak positive correlation between the proportion of Immigrants and poverty level among families in the United States with a correlation coefficient (R) of 0.271 and weighted average of 10.0%. Similarly, the statistical analysis conducted on geographies consisting of 93,955,553 people shows no correlation between the proportion of Ugandans and poverty level among families in the United States with a correlation coefficient (R) of -0.010 and weighted average of 9.3%, a difference of 7.5%.
Family Poverty Correlation Summary
| Measurement | Immigrants | Ugandan |
| Minimum | 5.5% | 1.0% |
| Maximum | 61.7% | 24.9% |
| Range | 56.2% | 23.8% |
| Mean | 10.8% | 9.7% |
| Median | 10.2% | 8.5% |
| Interquartile 25% (IQ1) | 8.9% | 6.0% |
| Interquartile 75% (IQ3) | 11.9% | 12.7% |
| Interquartile Range (IQR) | 3.0% | 6.7% |
| Standard Deviation (Sample) | 4.7% | 5.4% |
| Standard Deviation (Population) | 4.7% | 5.4% |
Similar Demographics by Family Poverty
Demographics Similar to Immigrants by Family Poverty
In terms of family poverty, the demographic groups most similar to Immigrants are Marshallese (9.9%, a difference of 0.25%), Ottawa (10.0%, a difference of 0.27%), Immigrants from Armenia (10.0%, a difference of 0.29%), Sudanese (10.0%, a difference of 0.49%), and Immigrants from Uzbekistan (10.0%, a difference of 0.51%).
| Demographics | Rating | Rank | Family Poverty |
| Panamanians | 5.6 /100 | #218 | Tragic 9.8% |
| Immigrants | Eritrea | 5.4 /100 | #219 | Tragic 9.9% |
| Bermudans | 5.3 /100 | #220 | Tragic 9.9% |
| Immigrants | Cambodia | 4.8 /100 | #221 | Tragic 9.9% |
| Japanese | 4.8 /100 | #222 | Tragic 9.9% |
| Immigrants | Africa | 4.3 /100 | #223 | Tragic 9.9% |
| Marshallese | 3.9 /100 | #224 | Tragic 9.9% |
| Immigrants | Immigrants | 3.6 /100 | #225 | Tragic 10.0% |
| Ottawa | 3.3 /100 | #226 | Tragic 10.0% |
| Immigrants | Armenia | 3.3 /100 | #227 | Tragic 10.0% |
| Sudanese | 3.1 /100 | #228 | Tragic 10.0% |
| Immigrants | Uzbekistan | 3.1 /100 | #229 | Tragic 10.0% |
| Immigrants | Panama | 3.1 /100 | #230 | Tragic 10.0% |
| Alaskan Athabascans | 2.7 /100 | #231 | Tragic 10.1% |
| Immigrants | Sudan | 2.3 /100 | #232 | Tragic 10.1% |
Demographics Similar to Ugandans by Family Poverty
In terms of family poverty, the demographic groups most similar to Ugandans are Spanish (9.3%, a difference of 0.010%), Immigrants from Western Asia (9.3%, a difference of 0.080%), South American (9.3%, a difference of 0.10%), Venezuelan (9.3%, a difference of 0.22%), and Arab (9.2%, a difference of 0.41%).
| Demographics | Rating | Rank | Family Poverty |
| South American Indians | 38.7 /100 | #184 | Fair 9.1% |
| Immigrants | Saudi Arabia | 38.6 /100 | #185 | Fair 9.1% |
| Colombians | 36.1 /100 | #186 | Fair 9.2% |
| Delaware | 35.4 /100 | #187 | Fair 9.2% |
| Immigrants | Kenya | 34.0 /100 | #188 | Fair 9.2% |
| Immigrants | Afghanistan | 32.1 /100 | #189 | Fair 9.2% |
| Arabs | 31.5 /100 | #190 | Fair 9.2% |
| Ugandans | 28.7 /100 | #191 | Fair 9.3% |
| Spanish | 28.7 /100 | #192 | Fair 9.3% |
| Immigrants | Western Asia | 28.2 /100 | #193 | Fair 9.3% |
| South Americans | 28.1 /100 | #194 | Fair 9.3% |
| Venezuelans | 27.4 /100 | #195 | Fair 9.3% |
| Immigrants | Venezuela | 26.1 /100 | #196 | Fair 9.3% |
| Immigrants | Colombia | 24.4 /100 | #197 | Fair 9.3% |
| Iraqis | 24.2 /100 | #198 | Fair 9.3% |