Immigrants vs Dutch Family Poverty
COMPARE
Immigrants
Dutch
Family Poverty
Family Poverty Comparison
Immigrants
Dutch
10.0%
FAMILY POVERTY
3.6/ 100
METRIC RATING
225th/ 347
METRIC RANK
7.8%
FAMILY POVERTY
98.3/ 100
METRIC RATING
66th/ 347
METRIC RANK
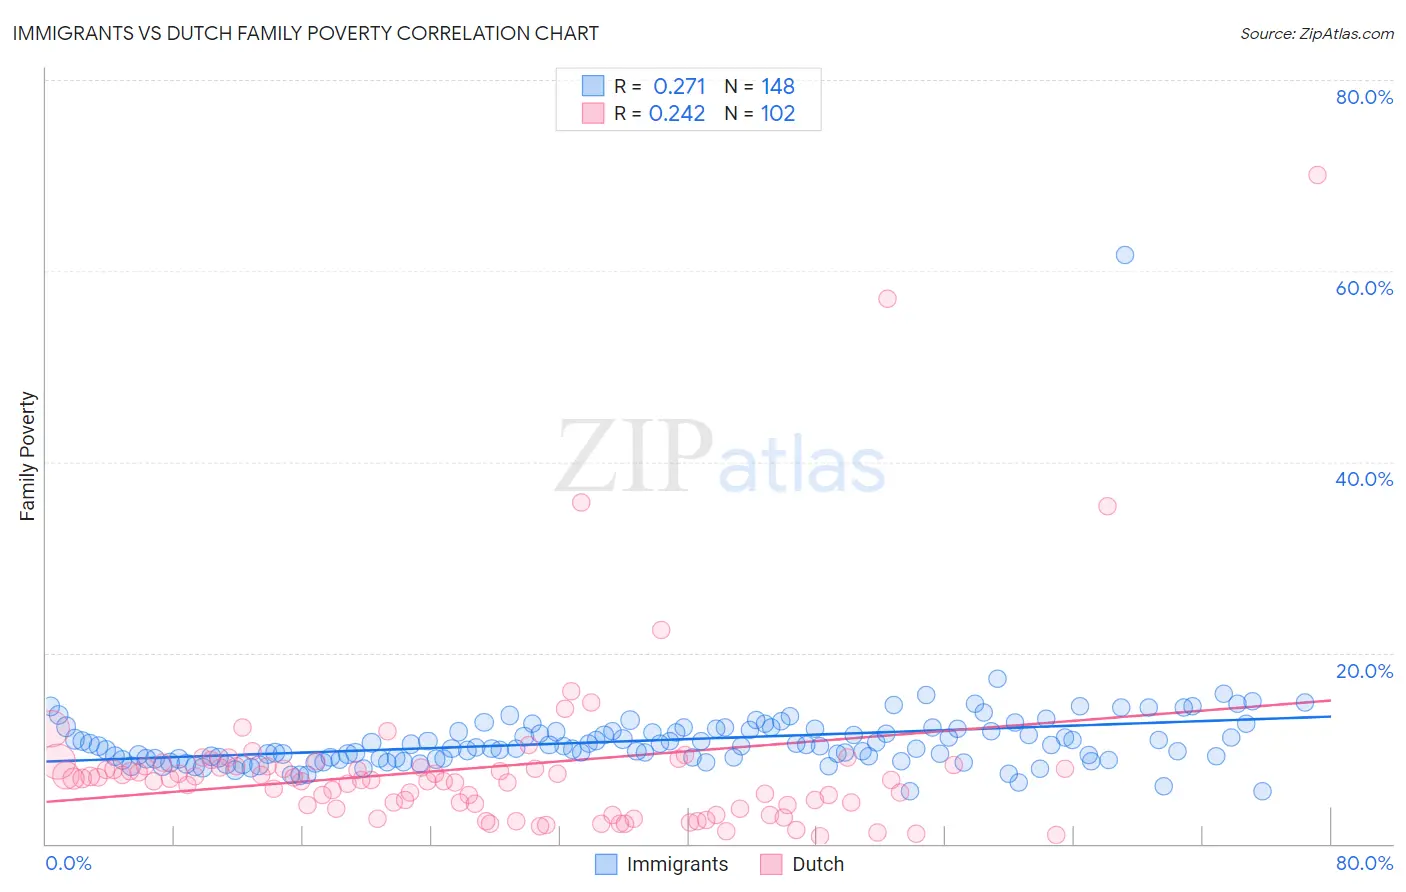
Immigrants vs Dutch Family Poverty Correlation Chart
The statistical analysis conducted on geographies consisting of 572,663,107 people shows a weak positive correlation between the proportion of Immigrants and poverty level among families in the United States with a correlation coefficient (R) of 0.271 and weighted average of 10.0%. Similarly, the statistical analysis conducted on geographies consisting of 550,370,007 people shows a weak positive correlation between the proportion of Dutch and poverty level among families in the United States with a correlation coefficient (R) of 0.242 and weighted average of 7.8%, a difference of 27.6%.
Family Poverty Correlation Summary
| Measurement | Immigrants | Dutch |
| Minimum | 5.5% | 0.79% |
| Maximum | 61.7% | 70.0% |
| Range | 56.2% | 69.2% |
| Mean | 10.8% | 8.0% |
| Median | 10.2% | 6.7% |
| Interquartile 25% (IQ1) | 8.9% | 4.0% |
| Interquartile 75% (IQ3) | 11.9% | 8.1% |
| Interquartile Range (IQR) | 3.0% | 4.1% |
| Standard Deviation (Sample) | 4.7% | 9.6% |
| Standard Deviation (Population) | 4.7% | 9.5% |
Similar Demographics by Family Poverty
Demographics Similar to Immigrants by Family Poverty
In terms of family poverty, the demographic groups most similar to Immigrants are Marshallese (9.9%, a difference of 0.25%), Ottawa (10.0%, a difference of 0.27%), Immigrants from Armenia (10.0%, a difference of 0.29%), Sudanese (10.0%, a difference of 0.49%), and Immigrants from Uzbekistan (10.0%, a difference of 0.51%).
| Demographics | Rating | Rank | Family Poverty |
| Panamanians | 5.6 /100 | #218 | Tragic 9.8% |
| Immigrants | Eritrea | 5.4 /100 | #219 | Tragic 9.9% |
| Bermudans | 5.3 /100 | #220 | Tragic 9.9% |
| Immigrants | Cambodia | 4.8 /100 | #221 | Tragic 9.9% |
| Japanese | 4.8 /100 | #222 | Tragic 9.9% |
| Immigrants | Africa | 4.3 /100 | #223 | Tragic 9.9% |
| Marshallese | 3.9 /100 | #224 | Tragic 9.9% |
| Immigrants | Immigrants | 3.6 /100 | #225 | Tragic 10.0% |
| Ottawa | 3.3 /100 | #226 | Tragic 10.0% |
| Immigrants | Armenia | 3.3 /100 | #227 | Tragic 10.0% |
| Sudanese | 3.1 /100 | #228 | Tragic 10.0% |
| Immigrants | Uzbekistan | 3.1 /100 | #229 | Tragic 10.0% |
| Immigrants | Panama | 3.1 /100 | #230 | Tragic 10.0% |
| Alaskan Athabascans | 2.7 /100 | #231 | Tragic 10.1% |
| Immigrants | Sudan | 2.3 /100 | #232 | Tragic 10.1% |
Demographics Similar to Dutch by Family Poverty
In terms of family poverty, the demographic groups most similar to Dutch are Northern European (7.8%, a difference of 0.010%), Australian (7.8%, a difference of 0.040%), Immigrants from Bulgaria (7.8%, a difference of 0.060%), Immigrants from Belgium (7.8%, a difference of 0.060%), and Korean (7.8%, a difference of 0.070%).
| Demographics | Rating | Rank | Family Poverty |
| Europeans | 98.7 /100 | #59 | Exceptional 7.7% |
| Immigrants | Greece | 98.7 /100 | #60 | Exceptional 7.7% |
| Immigrants | Netherlands | 98.6 /100 | #61 | Exceptional 7.7% |
| Macedonians | 98.6 /100 | #62 | Exceptional 7.8% |
| Zimbabweans | 98.4 /100 | #63 | Exceptional 7.8% |
| Koreans | 98.3 /100 | #64 | Exceptional 7.8% |
| Immigrants | Bulgaria | 98.3 /100 | #65 | Exceptional 7.8% |
| Dutch | 98.3 /100 | #66 | Exceptional 7.8% |
| Northern Europeans | 98.3 /100 | #67 | Exceptional 7.8% |
| Australians | 98.2 /100 | #68 | Exceptional 7.8% |
| Immigrants | Belgium | 98.2 /100 | #69 | Exceptional 7.8% |
| Immigrants | Canada | 98.2 /100 | #70 | Exceptional 7.8% |
| Cambodians | 98.2 /100 | #71 | Exceptional 7.8% |
| Immigrants | Romania | 98.2 /100 | #72 | Exceptional 7.8% |
| Austrians | 98.2 /100 | #73 | Exceptional 7.8% |