Immigrants vs Polish Family Poverty

COMPARE

Immigrants
Race
Ancestry
AfghanAfricanAlaska NativeAlaskan AthabascanAlbanianAleutAlsatianAmericanApacheArabArapahoArgentineanArmenianAssyrian/Chaldean/SyriacAustralianAustrianBahamianBangladeshiBarbadianBasqueBelgianBelizeanBermudanBhutaneseBlackfeetBolivianBrazilianBritishBritish West IndianBulgarianBurmeseCajunCambodianCanadianCape VerdeanCarpatho RusynCelticCentral AmericanCentral American IndianCherokeeCheyenneChickasawChileanChineseChippewaChoctawColombianColvilleComancheCosta RicanCreeCreekCroatianCrowCubanCypriotCzechCzechoslovakianDanishDelawareDominicanDutchDutch West IndianEastern EuropeanEcuadorianEgyptianEnglishEstonianEthiopianEuropeanFijianFilipinoFinnishFrenchFrench American IndianFrench CanadianGermanGerman RussianGhanaianGreekGuamanian/ChamorroGuatemalanGuyaneseHaitianHmongHonduranHopiHoumaHungarianIcelanderIndian (Asian)IndonesianInupiatIranianIraqiIrishIroquoisIsraeliItalianJamaicanJapaneseJordanianKenyanKiowaKoreanLaotianLatvianLebaneseLiberianLithuanianLumbeeLuxembourgerMacedonianMalaysianMalteseMarshalleseMenomineeMexicanMexican American IndianMongolianMoroccanNative HawaiianNavajoNepaleseNew ZealanderNicaraguanNigerianNorthern EuropeanNorwegianOkinawanOsageOttawaPaiutePakistaniPalestinianPanamanianParaguayanPennsylvania GermanPeruvianPimaPortuguesePotawatomiPuebloPuerto RicanPuget Sound SalishRomanianRussianSalvadoranSamoanScandinavianScotch-IrishScottishSeminoleSenegaleseSerbianShoshoneSierra LeoneanSiouxSlavicSlovakSloveneSomaliSouth AfricanSouth AmericanSouth American IndianSoviet UnionSpaniardSpanishSpanish AmericanSpanish American IndianSri LankanSubsaharan AfricanSudaneseSwedishSwissSyrianTaiwaneseThaiTlingit-HaidaTohono O'OdhamTonganTrinidadian and TobagonianTsimshianTurkishU.S. Virgin IslanderUgandanUkrainianUruguayanUteVenezuelanVietnameseWelshWest IndianYakamaYaquiYugoslavianYumanYup'ikZimbabwean
Immigration
NonimmigrantsImmigrantsAfghanistanAfricaAlbaniaArgentinaArmeniaAsiaAustraliaAustriaBahamasBangladeshBarbadosBelarusBelgiumBelizeBoliviaBosnia and HerzegovinaBrazilBulgariaBurma/MyanmarCabo VerdeCambodiaCameroonCanadaCaribbeanCentral AmericaChileChinaColombiaCongoCosta RicaCroatiaCubaCzechoslovakiaDenmarkDominicaDominican RepublicEastern AfricaEastern AsiaEastern EuropeEcuadorEgyptEl SalvadorEnglandEritreaEthiopiaEuropeFijiFranceGermanyGhanaGreeceGrenadaGuatemalaGuyanaHaitiHondurasHong KongHungaryIndiaIndonesiaIranIraqIrelandIsraelItalyJamaicaJapanJordanKazakhstanKenyaKoreaKuwaitLaosLatin AmericaLatviaLebanonLiberiaLithuaniaMalaysiaMexicoMicronesiaMiddle AfricaMoldovaMoroccoNepalNetherlandsNicaraguaNigeriaNorth AmericaNorth MacedoniaNorthern AfricaNorthern EuropeNorwayOceaniaPakistanPanamaPeruPhilippinesPolandPortugalRomaniaRussiaSaudi ArabiaScotlandSenegalSerbiaSierra LeoneSingaporeSomaliaSouth AfricaSouth AmericaSouth Central AsiaSouth Eastern AsiaSouthern EuropeSpainSri LankaSt. Vincent and the GrenadinesSudanSwedenSwitzerlandSyriaTaiwanThailandTrinidad and TobagoTurkeyUgandaUkraineUruguayUzbekistanVenezuelaVietnamWest IndiesWestern AfricaWestern AsiaWestern EuropeYemenZaireZimbabweAzores
Polish
Race
Ancestry
AfghanAfricanAlaska NativeAlaskan AthabascanAlbanianAleutAlsatianAmericanApacheArabArapahoArgentineanArmenianAssyrian/Chaldean/SyriacAustralianAustrianBahamianBangladeshiBarbadianBasqueBelgianBelizeanBermudanBhutaneseBlackfeetBolivianBrazilianBritishBritish West IndianBulgarianBurmeseCajunCambodianCanadianCape VerdeanCarpatho RusynCelticCentral AmericanCentral American IndianCherokeeCheyenneChickasawChileanChineseChippewaChoctawColombianColvilleComancheCosta RicanCreeCreekCroatianCrowCubanCypriotCzechCzechoslovakianDanishDelawareDominicanDutchDutch West IndianEastern EuropeanEcuadorianEgyptianEnglishEstonianEthiopianEuropeanFijianFilipinoFinnishFrenchFrench American IndianFrench CanadianGermanGerman RussianGhanaianGreekGuamanian/ChamorroGuatemalanGuyaneseHaitianHmongHonduranHopiHoumaHungarianIcelanderIndian (Asian)IndonesianInupiatIranianIraqiIrishIroquoisIsraeliItalianJamaicanJapaneseJordanianKenyanKiowaKoreanLaotianLatvianLebaneseLiberianLithuanianLumbeeLuxembourgerMacedonianMalaysianMalteseMarshalleseMenomineeMexicanMexican American IndianMongolianMoroccanNative HawaiianNavajoNepaleseNew ZealanderNicaraguanNigerianNorthern EuropeanNorwegianOkinawanOsageOttawaPaiutePakistaniPalestinianPanamanianParaguayanPennsylvania GermanPeruvianPimaPolishPortuguesePotawatomiPuebloPuerto RicanPuget Sound SalishRomanianRussianSalvadoranSamoanScandinavianScotch-IrishScottishSeminoleSenegaleseSerbianShoshoneSierra LeoneanSiouxSlavicSlovakSloveneSomaliSouth AfricanSouth AmericanSouth American IndianSoviet UnionSpaniardSpanishSpanish AmericanSpanish American IndianSri LankanSubsaharan AfricanSudaneseSwedishSwissSyrianTaiwaneseThaiTlingit-HaidaTohono O'OdhamTonganTrinidadian and TobagonianTsimshianTurkishU.S. Virgin IslanderUgandanUkrainianUruguayanUteVenezuelanVietnameseWelshWest IndianYakamaYaquiYugoslavianYumanYup'ikZimbabwean
Immigration
NonimmigrantsAfghanistanAfricaAlbaniaArgentinaArmeniaAsiaAustraliaAustriaBahamasBangladeshBarbadosBelarusBelgiumBelizeBoliviaBosnia and HerzegovinaBrazilBulgariaBurma/MyanmarCabo VerdeCambodiaCameroonCanadaCaribbeanCentral AmericaChileChinaColombiaCongoCosta RicaCroatiaCubaCzechoslovakiaDenmarkDominicaDominican RepublicEastern AfricaEastern AsiaEastern EuropeEcuadorEgyptEl SalvadorEnglandEritreaEthiopiaEuropeFijiFranceGermanyGhanaGreeceGrenadaGuatemalaGuyanaHaitiHondurasHong KongHungaryIndiaIndonesiaIranIraqIrelandIsraelItalyJamaicaJapanJordanKazakhstanKenyaKoreaKuwaitLaosLatin AmericaLatviaLebanonLiberiaLithuaniaMalaysiaMexicoMicronesiaMiddle AfricaMoldovaMoroccoNepalNetherlandsNicaraguaNigeriaNorth AmericaNorth MacedoniaNorthern AfricaNorthern EuropeNorwayOceaniaPakistanPanamaPeruPhilippinesPolandPortugalRomaniaRussiaSaudi ArabiaScotlandSenegalSerbiaSierra LeoneSingaporeSomaliaSouth AfricaSouth AmericaSouth Central AsiaSouth Eastern AsiaSouthern EuropeSpainSri LankaSt. Vincent and the GrenadinesSudanSwedenSwitzerlandSyriaTaiwanThailandTrinidad and TobagoTurkeyUgandaUkraineUruguayUzbekistanVenezuelaVietnamWest IndiesWestern AfricaWestern AsiaWestern EuropeYemenZaireZimbabweAzores
Family Poverty
Income
Poverty
Unemployment
Labor Participation
Family Structure
Vehicle Availability
Education Level
Disability

Family Poverty Comparison

Immigrants

Poles

Tragic
Exceptional
10.0%
FAMILY POVERTY
3.6/ 100
METRIC RATING
225th/ 347
METRIC RANK
7.4%
FAMILY POVERTY
99.5/ 100
METRIC RATING
32nd/ 347
METRIC RANK

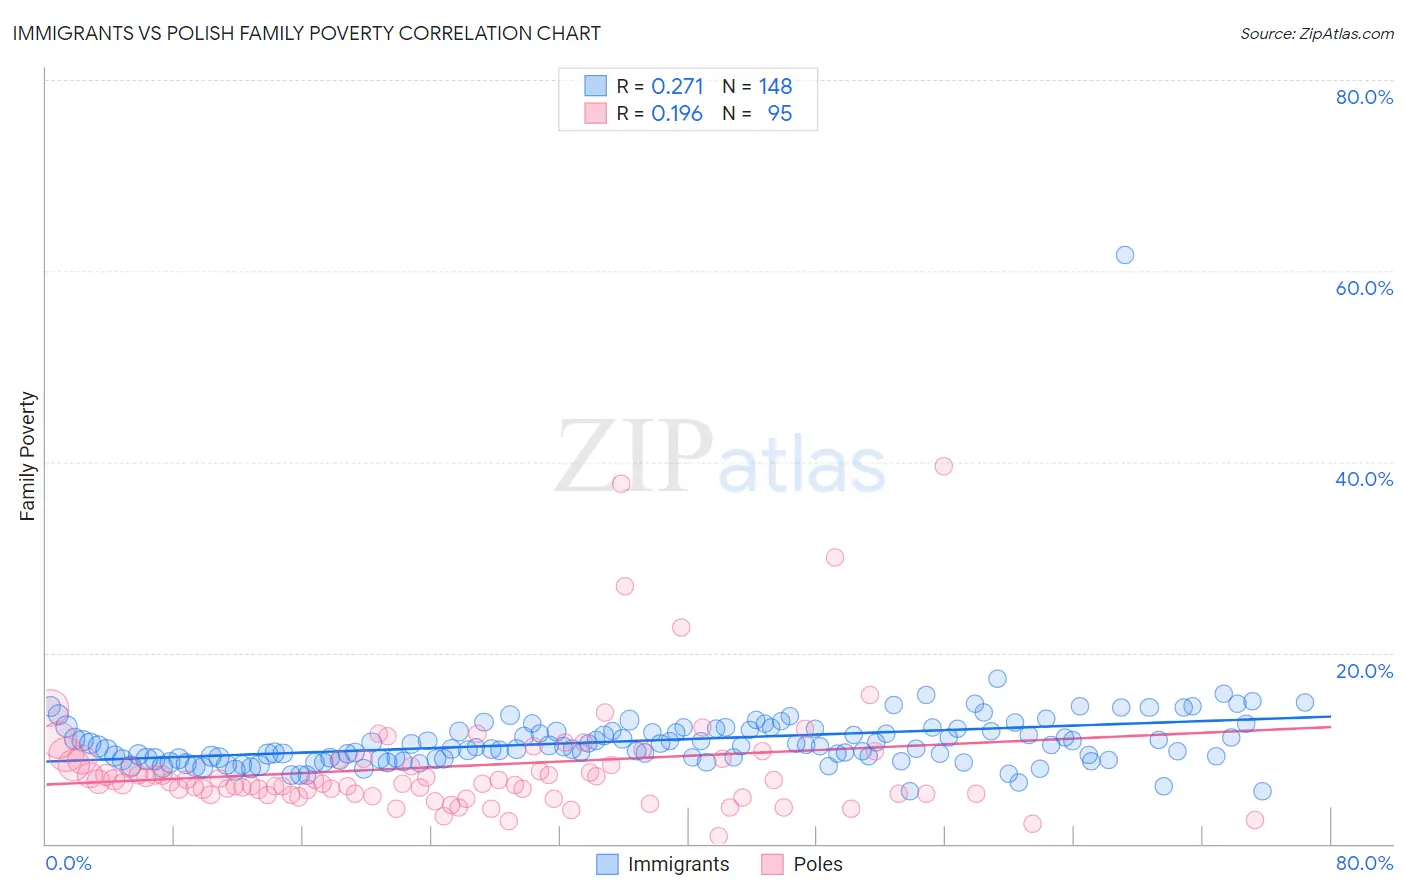
Immigrants vs Polish Family Poverty Correlation Chart

The statistical analysis conducted on geographies consisting of 572,663,107 people shows a weak positive correlation between the proportion of Immigrants and poverty level among families in the United States with a correlation coefficient (R) of 0.271 and weighted average of 10.0%. Similarly, the statistical analysis conducted on geographies consisting of 555,842,099 people shows a poor positive correlation between the proportion of Poles and poverty level among families in the United States with a correlation coefficient (R) of 0.196 and weighted average of 7.4%, a difference of 34.1%.
Immigrants vs Polish Family Poverty

Family Poverty Correlation Summary

MeasurementImmigrantsPolish
Minimum5.5%0.85%
Maximum61.7%39.6%
Range56.2%38.7%
Mean10.8%8.1%
Median10.2%6.5%
Interquartile 25% (IQ1)8.9%5.2%
Interquartile 75% (IQ3)11.9%8.8%
Interquartile Range (IQR)3.0%3.6%
Standard Deviation (Sample)4.7%6.3%
Standard Deviation (Population)4.7%6.3%

Similar Demographics by Family Poverty

Demographics Similar to Immigrants by Family Poverty

In terms of family poverty, the demographic groups most similar to Immigrants are Marshallese (9.9%, a difference of 0.25%), Ottawa (10.0%, a difference of 0.27%), Immigrants from Armenia (10.0%, a difference of 0.29%), Sudanese (10.0%, a difference of 0.49%), and Immigrants from Uzbekistan (10.0%, a difference of 0.51%).
DemographicsRating | RankFamily Poverty
Panamanians
5.6
/100
|
#218
Tragic
9.8%
Immigrants | Eritrea
5.4
/100
|
#219
Tragic
9.9%
Bermudans
5.3
/100
|
#220
Tragic
9.9%
Immigrants | Cambodia
4.8
/100
|
#221
Tragic
9.9%
Japanese
4.8
/100
|
#222
Tragic
9.9%
Immigrants | Africa
4.3
/100
|
#223
Tragic
9.9%
Marshallese
3.9
/100
|
#224
Tragic
9.9%
Immigrants | Immigrants
3.6
/100
|
#225
Tragic
10.0%
Ottawa
3.3
/100
|
#226
Tragic
10.0%
Immigrants | Armenia
3.3
/100
|
#227
Tragic
10.0%
Sudanese
3.1
/100
|
#228
Tragic
10.0%
Immigrants | Uzbekistan
3.1
/100
|
#229
Tragic
10.0%
Immigrants | Panama
3.1
/100
|
#230
Tragic
10.0%
Alaskan Athabascans
2.7
/100
|
#231
Tragic
10.1%
Immigrants | Sudan
2.3
/100
|
#232
Tragic
10.1%

Demographics Similar to Poles by Family Poverty

In terms of family poverty, the demographic groups most similar to Poles are Immigrants from Japan (7.4%, a difference of 0.0%), Russian (7.5%, a difference of 0.23%), Czech (7.4%, a difference of 0.30%), Italian (7.4%, a difference of 0.42%), and Immigrants from Northern Europe (7.4%, a difference of 0.71%).
DemographicsRating | RankFamily Poverty
Burmese
99.7
/100
|
#25
Exceptional
7.3%
Cypriots
99.6
/100
|
#26
Exceptional
7.3%
Immigrants | Scotland
99.6
/100
|
#27
Exceptional
7.3%
Immigrants | Korea
99.6
/100
|
#28
Exceptional
7.4%
Immigrants | Northern Europe
99.6
/100
|
#29
Exceptional
7.4%
Italians
99.6
/100
|
#30
Exceptional
7.4%
Czechs
99.6
/100
|
#31
Exceptional
7.4%
Poles
99.5
/100
|
#32
Exceptional
7.4%
Immigrants | Japan
99.5
/100
|
#33
Exceptional
7.4%
Russians
99.5
/100
|
#34
Exceptional
7.5%
Greeks
99.4
/100
|
#35
Exceptional
7.5%
Turks
99.4
/100
|
#36
Exceptional
7.5%
Estonians
99.4
/100
|
#37
Exceptional
7.5%
Bolivians
99.3
/100
|
#38
Exceptional
7.5%
Carpatho Rusyns
99.3
/100
|
#39
Exceptional
7.5%