Immigrants from Korea vs Kiowa Family Poverty
COMPARE
Immigrants from Korea
Kiowa
Family Poverty
Family Poverty Comparison
Immigrants from Korea
Kiowa
7.4%
FAMILY POVERTY
99.6/ 100
METRIC RATING
28th/ 347
METRIC RANK
12.2%
FAMILY POVERTY
0.0/ 100
METRIC RATING
314th/ 347
METRIC RANK
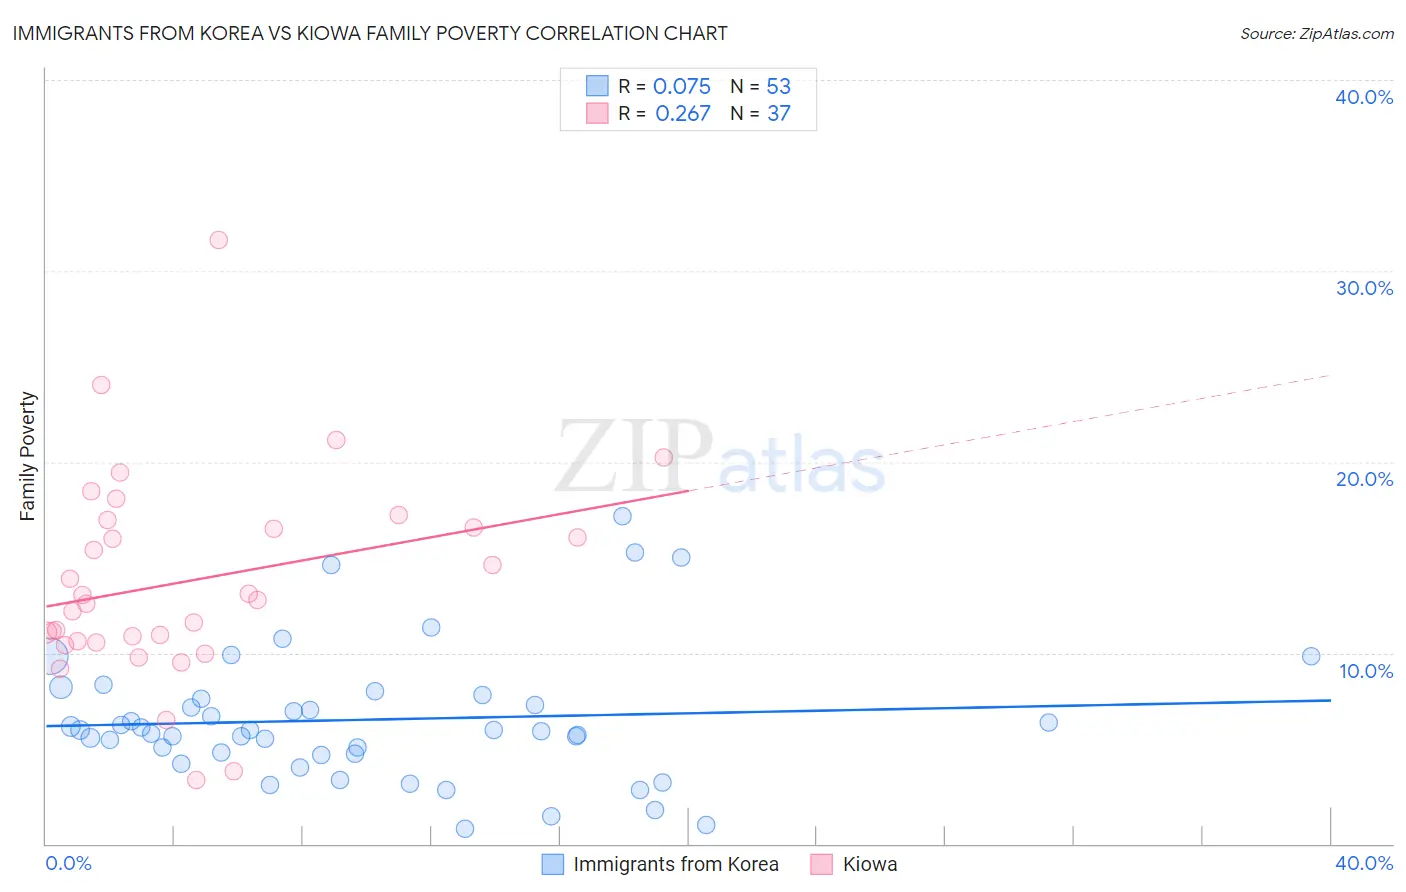
Immigrants from Korea vs Kiowa Family Poverty Correlation Chart
The statistical analysis conducted on geographies consisting of 414,824,351 people shows a slight positive correlation between the proportion of Immigrants from Korea and poverty level among families in the United States with a correlation coefficient (R) of 0.075 and weighted average of 7.4%. Similarly, the statistical analysis conducted on geographies consisting of 56,081,442 people shows a weak positive correlation between the proportion of Kiowa and poverty level among families in the United States with a correlation coefficient (R) of 0.267 and weighted average of 12.2%, a difference of 66.1%.
Family Poverty Correlation Summary
| Measurement | Immigrants from Korea | Kiowa |
| Minimum | 0.76% | 3.4% |
| Maximum | 17.2% | 31.6% |
| Range | 16.4% | 28.3% |
| Mean | 6.5% | 13.8% |
| Median | 5.9% | 12.8% |
| Interquartile 25% (IQ1) | 4.7% | 10.6% |
| Interquartile 75% (IQ3) | 7.7% | 16.8% |
| Interquartile Range (IQR) | 3.0% | 6.2% |
| Standard Deviation (Sample) | 3.5% | 5.4% |
| Standard Deviation (Population) | 3.5% | 5.3% |
Similar Demographics by Family Poverty
Demographics Similar to Immigrants from Korea by Family Poverty
In terms of family poverty, the demographic groups most similar to Immigrants from Korea are Immigrants from Northern Europe (7.4%, a difference of 0.17%), Immigrants from Scotland (7.3%, a difference of 0.39%), Cypriot (7.3%, a difference of 0.40%), Italian (7.4%, a difference of 0.46%), and Czech (7.4%, a difference of 0.58%).
| Demographics | Rating | Rank | Family Poverty |
| Immigrants | Iran | 99.7 /100 | #21 | Exceptional 7.3% |
| Danes | 99.7 /100 | #22 | Exceptional 7.3% |
| Assyrians/Chaldeans/Syriacs | 99.7 /100 | #23 | Exceptional 7.3% |
| Croatians | 99.7 /100 | #24 | Exceptional 7.3% |
| Burmese | 99.7 /100 | #25 | Exceptional 7.3% |
| Cypriots | 99.6 /100 | #26 | Exceptional 7.3% |
| Immigrants | Scotland | 99.6 /100 | #27 | Exceptional 7.3% |
| Immigrants | Korea | 99.6 /100 | #28 | Exceptional 7.4% |
| Immigrants | Northern Europe | 99.6 /100 | #29 | Exceptional 7.4% |
| Italians | 99.6 /100 | #30 | Exceptional 7.4% |
| Czechs | 99.6 /100 | #31 | Exceptional 7.4% |
| Poles | 99.5 /100 | #32 | Exceptional 7.4% |
| Immigrants | Japan | 99.5 /100 | #33 | Exceptional 7.4% |
| Russians | 99.5 /100 | #34 | Exceptional 7.5% |
| Greeks | 99.4 /100 | #35 | Exceptional 7.5% |
Demographics Similar to Kiowa by Family Poverty
In terms of family poverty, the demographic groups most similar to Kiowa are Immigrants from Mexico (12.3%, a difference of 0.26%), Immigrants from Caribbean (12.2%, a difference of 0.50%), Honduran (12.4%, a difference of 1.0%), Immigrants from Central America (12.1%, a difference of 1.2%), and Immigrants from Grenada (12.4%, a difference of 1.2%).
| Demographics | Rating | Rank | Family Poverty |
| Immigrants | Congo | 0.0 /100 | #307 | Tragic 11.9% |
| Seminole | 0.0 /100 | #308 | Tragic 11.9% |
| Hispanics or Latinos | 0.0 /100 | #309 | Tragic 12.0% |
| Immigrants | Guatemala | 0.0 /100 | #310 | Tragic 12.0% |
| Ute | 0.0 /100 | #311 | Tragic 12.1% |
| Immigrants | Central America | 0.0 /100 | #312 | Tragic 12.1% |
| Immigrants | Caribbean | 0.0 /100 | #313 | Tragic 12.2% |
| Kiowa | 0.0 /100 | #314 | Tragic 12.2% |
| Immigrants | Mexico | 0.0 /100 | #315 | Tragic 12.3% |
| Hondurans | 0.0 /100 | #316 | Tragic 12.4% |
| Immigrants | Grenada | 0.0 /100 | #317 | Tragic 12.4% |
| U.S. Virgin Islanders | 0.0 /100 | #318 | Tragic 12.4% |
| British West Indians | 0.0 /100 | #319 | Tragic 12.4% |
| Inupiat | 0.0 /100 | #320 | Tragic 12.5% |
| Arapaho | 0.0 /100 | #321 | Tragic 12.7% |