Immigrants from Zimbabwe vs Immigrants from Yemen Family Poverty
COMPARE
Immigrants from Zimbabwe
Immigrants from Yemen
Family Poverty
Family Poverty Comparison
Immigrants from Zimbabwe
Immigrants from Yemen
8.2%
FAMILY POVERTY
94.0/ 100
METRIC RATING
114th/ 347
METRIC RANK
17.5%
FAMILY POVERTY
0.0/ 100
METRIC RATING
342nd/ 347
METRIC RANK
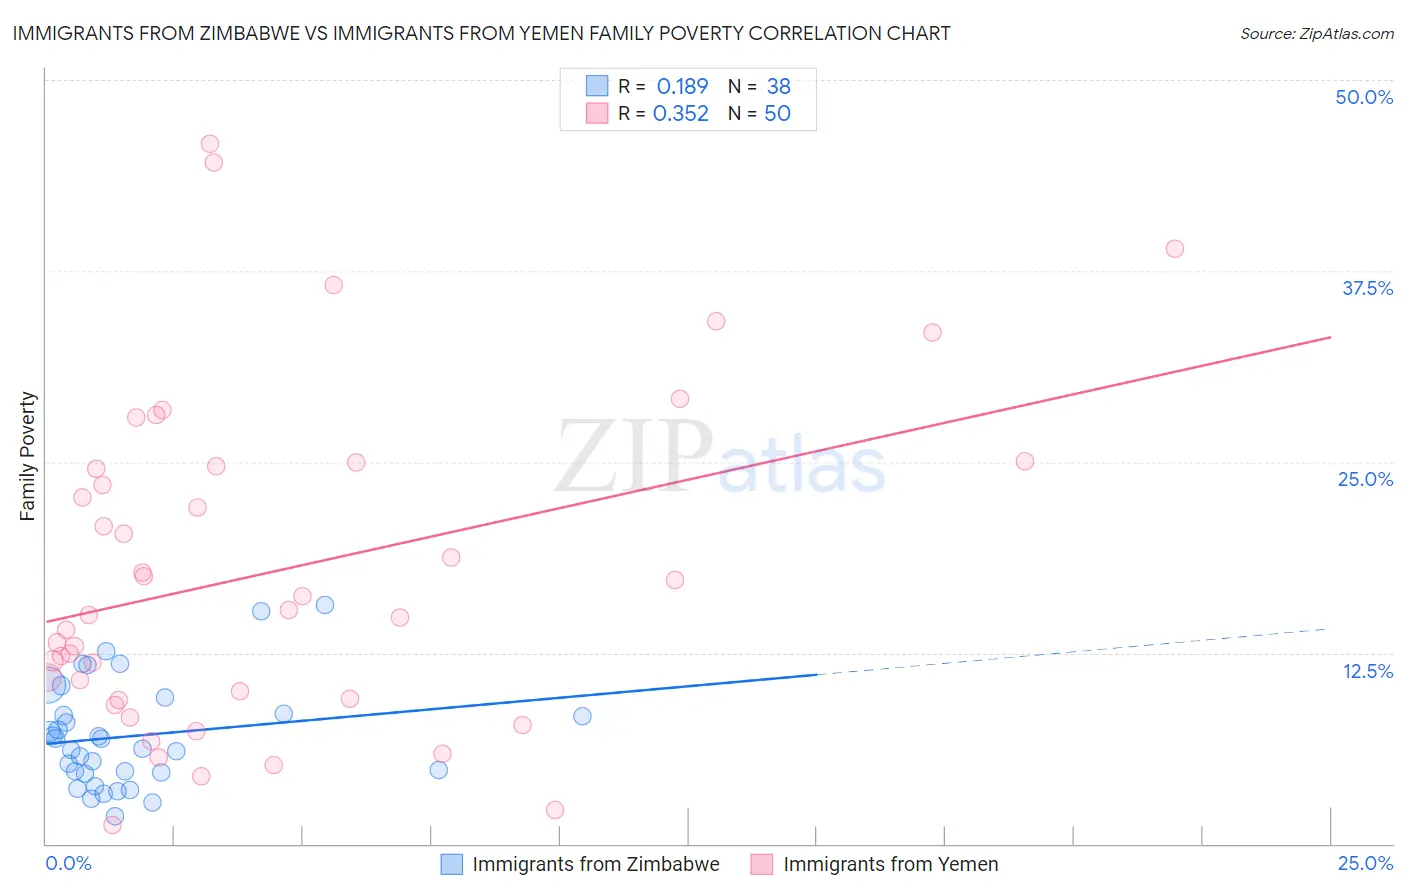
Immigrants from Zimbabwe vs Immigrants from Yemen Family Poverty Correlation Chart
The statistical analysis conducted on geographies consisting of 117,739,253 people shows a poor positive correlation between the proportion of Immigrants from Zimbabwe and poverty level among families in the United States with a correlation coefficient (R) of 0.189 and weighted average of 8.2%. Similarly, the statistical analysis conducted on geographies consisting of 82,405,331 people shows a mild positive correlation between the proportion of Immigrants from Yemen and poverty level among families in the United States with a correlation coefficient (R) of 0.352 and weighted average of 17.5%, a difference of 113.1%.
Family Poverty Correlation Summary
| Measurement | Immigrants from Zimbabwe | Immigrants from Yemen |
| Minimum | 1.8% | 1.2% |
| Maximum | 15.6% | 45.8% |
| Range | 13.8% | 44.6% |
| Mean | 7.1% | 17.8% |
| Median | 6.5% | 15.2% |
| Interquartile 25% (IQ1) | 4.7% | 9.5% |
| Interquartile 75% (IQ3) | 8.5% | 24.7% |
| Interquartile Range (IQR) | 3.8% | 15.2% |
| Standard Deviation (Sample) | 3.4% | 10.8% |
| Standard Deviation (Population) | 3.4% | 10.7% |
Similar Demographics by Family Poverty
Demographics Similar to Immigrants from Zimbabwe by Family Poverty
In terms of family poverty, the demographic groups most similar to Immigrants from Zimbabwe are Canadian (8.2%, a difference of 0.090%), Immigrants from France (8.2%, a difference of 0.26%), Immigrants from Israel (8.2%, a difference of 0.34%), Taiwanese (8.2%, a difference of 0.37%), and South African (8.2%, a difference of 0.41%).
| Demographics | Rating | Rank | Family Poverty |
| French Canadians | 95.0 /100 | #107 | Exceptional 8.1% |
| Basques | 94.9 /100 | #108 | Exceptional 8.1% |
| Jordanians | 94.8 /100 | #109 | Exceptional 8.2% |
| Romanians | 94.7 /100 | #110 | Exceptional 8.2% |
| Taiwanese | 94.6 /100 | #111 | Exceptional 8.2% |
| Immigrants | France | 94.4 /100 | #112 | Exceptional 8.2% |
| Canadians | 94.2 /100 | #113 | Exceptional 8.2% |
| Immigrants | Zimbabwe | 94.0 /100 | #114 | Exceptional 8.2% |
| Immigrants | Israel | 93.5 /100 | #115 | Exceptional 8.2% |
| South Africans | 93.4 /100 | #116 | Exceptional 8.2% |
| Immigrants | Russia | 93.2 /100 | #117 | Exceptional 8.2% |
| Immigrants | Western Europe | 92.9 /100 | #118 | Exceptional 8.2% |
| French | 92.8 /100 | #119 | Exceptional 8.3% |
| Immigrants | Egypt | 91.6 /100 | #120 | Exceptional 8.3% |
| Native Hawaiians | 91.3 /100 | #121 | Exceptional 8.3% |
Demographics Similar to Immigrants from Yemen by Family Poverty
In terms of family poverty, the demographic groups most similar to Immigrants from Yemen are Lumbee (17.0%, a difference of 2.8%), Pueblo (17.0%, a difference of 2.8%), Yuman (16.6%, a difference of 5.0%), Pima (18.4%, a difference of 5.1%), and Yup'ik (18.7%, a difference of 7.1%).
| Demographics | Rating | Rank | Family Poverty |
| Immigrants | Dominican Republic | 0.0 /100 | #333 | Tragic 14.4% |
| Houma | 0.0 /100 | #334 | Tragic 14.6% |
| Apache | 0.0 /100 | #335 | Tragic 14.7% |
| Sioux | 0.0 /100 | #336 | Tragic 15.9% |
| Hopi | 0.0 /100 | #337 | Tragic 15.9% |
| Crow | 0.0 /100 | #338 | Tragic 16.1% |
| Yuman | 0.0 /100 | #339 | Tragic 16.6% |
| Pueblo | 0.0 /100 | #340 | Tragic 17.0% |
| Lumbee | 0.0 /100 | #341 | Tragic 17.0% |
| Immigrants | Yemen | 0.0 /100 | #342 | Tragic 17.5% |
| Pima | 0.0 /100 | #343 | Tragic 18.4% |
| Yup'ik | 0.0 /100 | #344 | Tragic 18.7% |
| Navajo | 0.0 /100 | #345 | Tragic 18.8% |
| Puerto Ricans | 0.0 /100 | #346 | Tragic 20.3% |
| Tohono O'odham | 0.0 /100 | #347 | Tragic 20.4% |