Immigrants from Zimbabwe vs Immigrants from Africa Family Poverty
COMPARE
Immigrants from Zimbabwe
Immigrants from Africa
Family Poverty
Family Poverty Comparison
Immigrants from Zimbabwe
Immigrants from Africa
8.2%
FAMILY POVERTY
94.0/ 100
METRIC RATING
114th/ 347
METRIC RANK
9.9%
FAMILY POVERTY
4.3/ 100
METRIC RATING
223rd/ 347
METRIC RANK
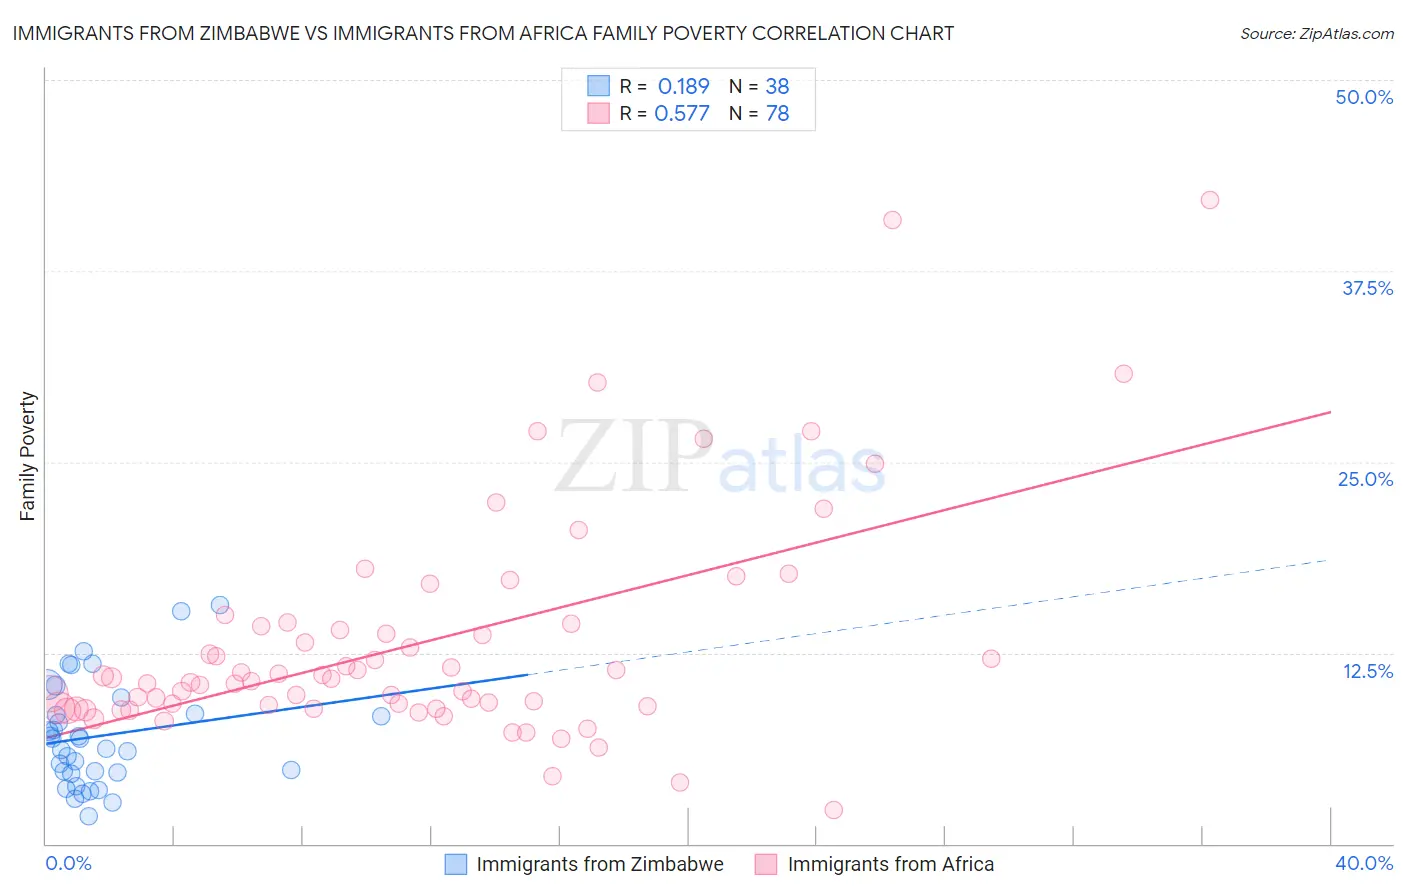
Immigrants from Zimbabwe vs Immigrants from Africa Family Poverty Correlation Chart
The statistical analysis conducted on geographies consisting of 117,739,253 people shows a poor positive correlation between the proportion of Immigrants from Zimbabwe and poverty level among families in the United States with a correlation coefficient (R) of 0.189 and weighted average of 8.2%. Similarly, the statistical analysis conducted on geographies consisting of 467,521,718 people shows a substantial positive correlation between the proportion of Immigrants from Africa and poverty level among families in the United States with a correlation coefficient (R) of 0.577 and weighted average of 9.9%, a difference of 21.0%.
Family Poverty Correlation Summary
| Measurement | Immigrants from Zimbabwe | Immigrants from Africa |
| Minimum | 1.8% | 2.2% |
| Maximum | 15.6% | 42.2% |
| Range | 13.8% | 40.0% |
| Mean | 7.1% | 13.1% |
| Median | 6.5% | 10.7% |
| Interquartile 25% (IQ1) | 4.7% | 8.9% |
| Interquartile 75% (IQ3) | 8.5% | 14.2% |
| Interquartile Range (IQR) | 3.8% | 5.3% |
| Standard Deviation (Sample) | 3.4% | 7.4% |
| Standard Deviation (Population) | 3.4% | 7.3% |
Similar Demographics by Family Poverty
Demographics Similar to Immigrants from Zimbabwe by Family Poverty
In terms of family poverty, the demographic groups most similar to Immigrants from Zimbabwe are Canadian (8.2%, a difference of 0.090%), Immigrants from France (8.2%, a difference of 0.26%), Immigrants from Israel (8.2%, a difference of 0.34%), Taiwanese (8.2%, a difference of 0.37%), and South African (8.2%, a difference of 0.41%).
| Demographics | Rating | Rank | Family Poverty |
| French Canadians | 95.0 /100 | #107 | Exceptional 8.1% |
| Basques | 94.9 /100 | #108 | Exceptional 8.1% |
| Jordanians | 94.8 /100 | #109 | Exceptional 8.2% |
| Romanians | 94.7 /100 | #110 | Exceptional 8.2% |
| Taiwanese | 94.6 /100 | #111 | Exceptional 8.2% |
| Immigrants | France | 94.4 /100 | #112 | Exceptional 8.2% |
| Canadians | 94.2 /100 | #113 | Exceptional 8.2% |
| Immigrants | Zimbabwe | 94.0 /100 | #114 | Exceptional 8.2% |
| Immigrants | Israel | 93.5 /100 | #115 | Exceptional 8.2% |
| South Africans | 93.4 /100 | #116 | Exceptional 8.2% |
| Immigrants | Russia | 93.2 /100 | #117 | Exceptional 8.2% |
| Immigrants | Western Europe | 92.9 /100 | #118 | Exceptional 8.2% |
| French | 92.8 /100 | #119 | Exceptional 8.3% |
| Immigrants | Egypt | 91.6 /100 | #120 | Exceptional 8.3% |
| Native Hawaiians | 91.3 /100 | #121 | Exceptional 8.3% |
Demographics Similar to Immigrants from Africa by Family Poverty
In terms of family poverty, the demographic groups most similar to Immigrants from Africa are Japanese (9.9%, a difference of 0.30%), Marshallese (9.9%, a difference of 0.30%), Immigrants from Cambodia (9.9%, a difference of 0.33%), Immigrants (10.0%, a difference of 0.55%), and Bermudan (9.9%, a difference of 0.61%).
| Demographics | Rating | Rank | Family Poverty |
| Moroccans | 6.5 /100 | #216 | Tragic 9.8% |
| Americans | 6.2 /100 | #217 | Tragic 9.8% |
| Panamanians | 5.6 /100 | #218 | Tragic 9.8% |
| Immigrants | Eritrea | 5.4 /100 | #219 | Tragic 9.9% |
| Bermudans | 5.3 /100 | #220 | Tragic 9.9% |
| Immigrants | Cambodia | 4.8 /100 | #221 | Tragic 9.9% |
| Japanese | 4.8 /100 | #222 | Tragic 9.9% |
| Immigrants | Africa | 4.3 /100 | #223 | Tragic 9.9% |
| Marshallese | 3.9 /100 | #224 | Tragic 9.9% |
| Immigrants | Immigrants | 3.6 /100 | #225 | Tragic 10.0% |
| Ottawa | 3.3 /100 | #226 | Tragic 10.0% |
| Immigrants | Armenia | 3.3 /100 | #227 | Tragic 10.0% |
| Sudanese | 3.1 /100 | #228 | Tragic 10.0% |
| Immigrants | Uzbekistan | 3.1 /100 | #229 | Tragic 10.0% |
| Immigrants | Panama | 3.1 /100 | #230 | Tragic 10.0% |