Immigrants from St. Vincent and the Grenadines vs Irish Poverty
COMPARE
Immigrants from St. Vincent and the Grenadines
Irish
Poverty
Poverty Comparison
Immigrants from St. Vincent and the Grenadines
Irish
14.9%
POVERTY
0.0/ 100
METRIC RATING
279th/ 347
METRIC RANK
11.3%
POVERTY
96.6/ 100
METRIC RATING
81st/ 347
METRIC RANK
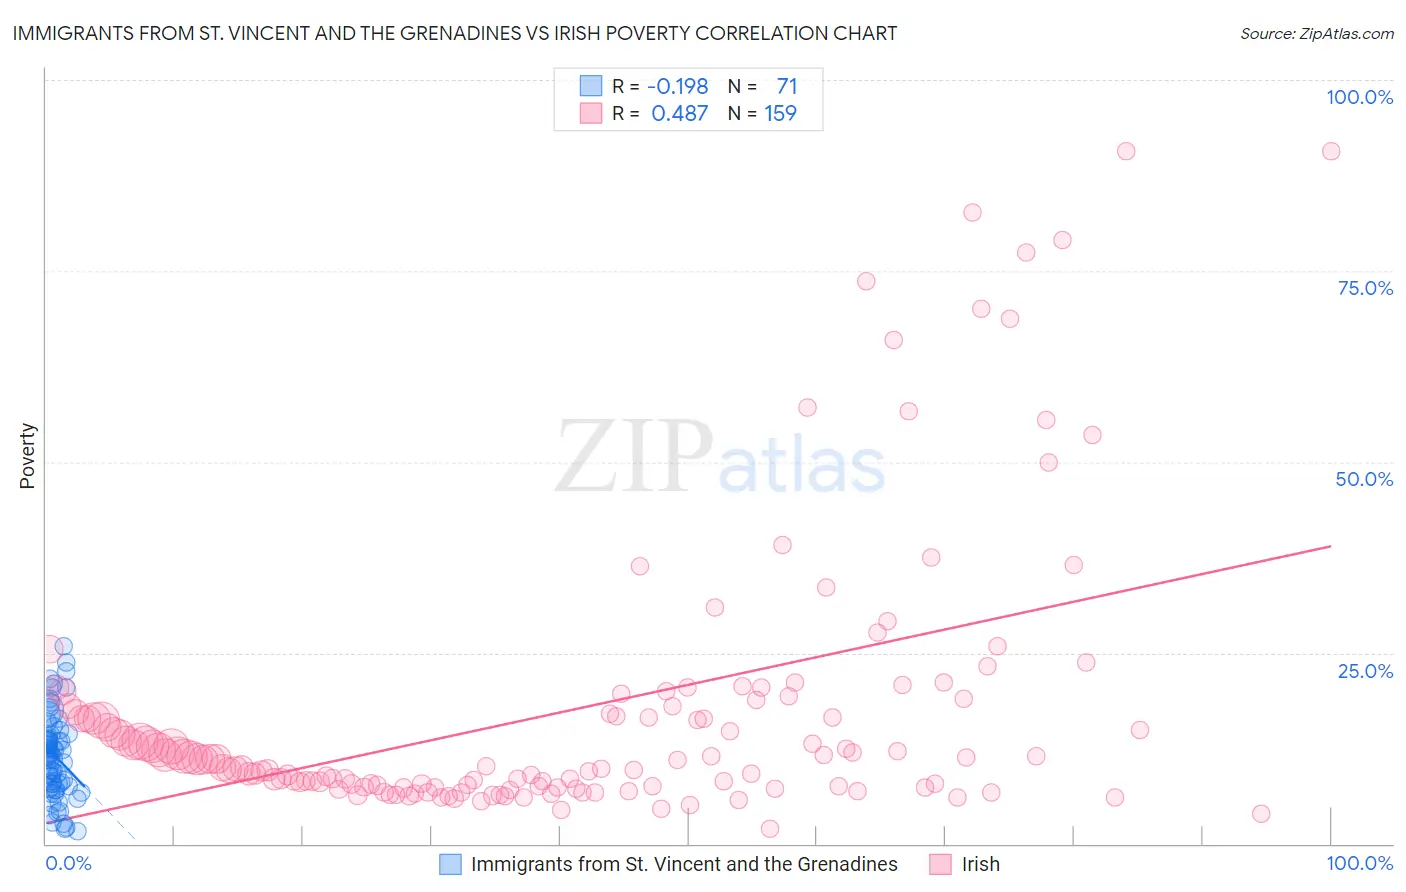
Immigrants from St. Vincent and the Grenadines vs Irish Poverty Correlation Chart
The statistical analysis conducted on geographies consisting of 56,091,353 people shows a poor negative correlation between the proportion of Immigrants from St. Vincent and the Grenadines and poverty level in the United States with a correlation coefficient (R) of -0.198 and weighted average of 14.9%. Similarly, the statistical analysis conducted on geographies consisting of 579,456,030 people shows a moderate positive correlation between the proportion of Irish and poverty level in the United States with a correlation coefficient (R) of 0.487 and weighted average of 11.3%, a difference of 31.4%.
Poverty Correlation Summary
| Measurement | Immigrants from St. Vincent and the Grenadines | Irish |
| Minimum | 1.6% | 2.0% |
| Maximum | 25.9% | 90.7% |
| Range | 24.3% | 88.7% |
| Mean | 11.5% | 17.4% |
| Median | 11.5% | 11.0% |
| Interquartile 25% (IQ1) | 7.5% | 7.5% |
| Interquartile 75% (IQ3) | 14.2% | 18.1% |
| Interquartile Range (IQR) | 6.7% | 10.6% |
| Standard Deviation (Sample) | 5.5% | 18.1% |
| Standard Deviation (Population) | 5.5% | 18.0% |
Similar Demographics by Poverty
Demographics Similar to Immigrants from St. Vincent and the Grenadines by Poverty
In terms of poverty, the demographic groups most similar to Immigrants from St. Vincent and the Grenadines are Haitian (14.9%, a difference of 0.20%), Immigrants from Barbados (14.9%, a difference of 0.27%), Belizean (14.8%, a difference of 0.29%), Bangladeshi (14.8%, a difference of 0.31%), and Immigrants from West Indies (14.8%, a difference of 0.37%).
| Demographics | Rating | Rank | Poverty |
| Chickasaw | 0.0 /100 | #272 | Tragic 14.7% |
| Spanish Americans | 0.0 /100 | #273 | Tragic 14.7% |
| Barbadians | 0.0 /100 | #274 | Tragic 14.8% |
| Immigrants | West Indies | 0.0 /100 | #275 | Tragic 14.8% |
| Immigrants | Bahamas | 0.0 /100 | #276 | Tragic 14.8% |
| Bangladeshis | 0.0 /100 | #277 | Tragic 14.8% |
| Belizeans | 0.0 /100 | #278 | Tragic 14.8% |
| Immigrants | St. Vincent and the Grenadines | 0.0 /100 | #279 | Tragic 14.9% |
| Haitians | 0.0 /100 | #280 | Tragic 14.9% |
| Immigrants | Barbados | 0.0 /100 | #281 | Tragic 14.9% |
| Comanche | 0.0 /100 | #282 | Tragic 15.0% |
| Immigrants | Haiti | 0.0 /100 | #283 | Tragic 15.0% |
| West Indians | 0.0 /100 | #284 | Tragic 15.0% |
| Vietnamese | 0.0 /100 | #285 | Tragic 15.0% |
| Immigrants | Latin America | 0.0 /100 | #286 | Tragic 15.0% |
Demographics Similar to Irish by Poverty
In terms of poverty, the demographic groups most similar to Irish are Indian (Asian) (11.3%, a difference of 0.0%), Cambodian (11.3%, a difference of 0.020%), Dutch (11.3%, a difference of 0.070%), Immigrants from Eastern Asia (11.3%, a difference of 0.080%), and Egyptian (11.3%, a difference of 0.090%).
| Demographics | Rating | Rank | Poverty |
| Carpatho Rusyns | 97.2 /100 | #74 | Exceptional 11.3% |
| Immigrants | Eastern Europe | 97.0 /100 | #75 | Exceptional 11.3% |
| Immigrants | North America | 96.8 /100 | #76 | Exceptional 11.3% |
| Immigrants | Eastern Asia | 96.7 /100 | #77 | Exceptional 11.3% |
| Dutch | 96.7 /100 | #78 | Exceptional 11.3% |
| Cambodians | 96.7 /100 | #79 | Exceptional 11.3% |
| Indians (Asian) | 96.6 /100 | #80 | Exceptional 11.3% |
| Irish | 96.6 /100 | #81 | Exceptional 11.3% |
| Egyptians | 96.5 /100 | #82 | Exceptional 11.3% |
| Immigrants | Sweden | 96.3 /100 | #83 | Exceptional 11.3% |
| English | 96.3 /100 | #84 | Exceptional 11.3% |
| Immigrants | England | 96.2 /100 | #85 | Exceptional 11.4% |
| Jordanians | 96.0 /100 | #86 | Exceptional 11.4% |
| Northern Europeans | 96.0 /100 | #87 | Exceptional 11.4% |
| Belgians | 95.8 /100 | #88 | Exceptional 11.4% |