Immigrants from Zaire vs Immigrants from Western Europe Single Male Poverty
COMPARE
Immigrants from Zaire
Immigrants from Western Europe
Single Male Poverty
Single Male Poverty Comparison
Immigrants from Zaire
Immigrants from Western Europe
13.6%
SINGLE MALE POVERTY
0.9/ 100
METRIC RATING
251st/ 347
METRIC RANK
13.2%
SINGLE MALE POVERTY
10.0/ 100
METRIC RATING
222nd/ 347
METRIC RANK
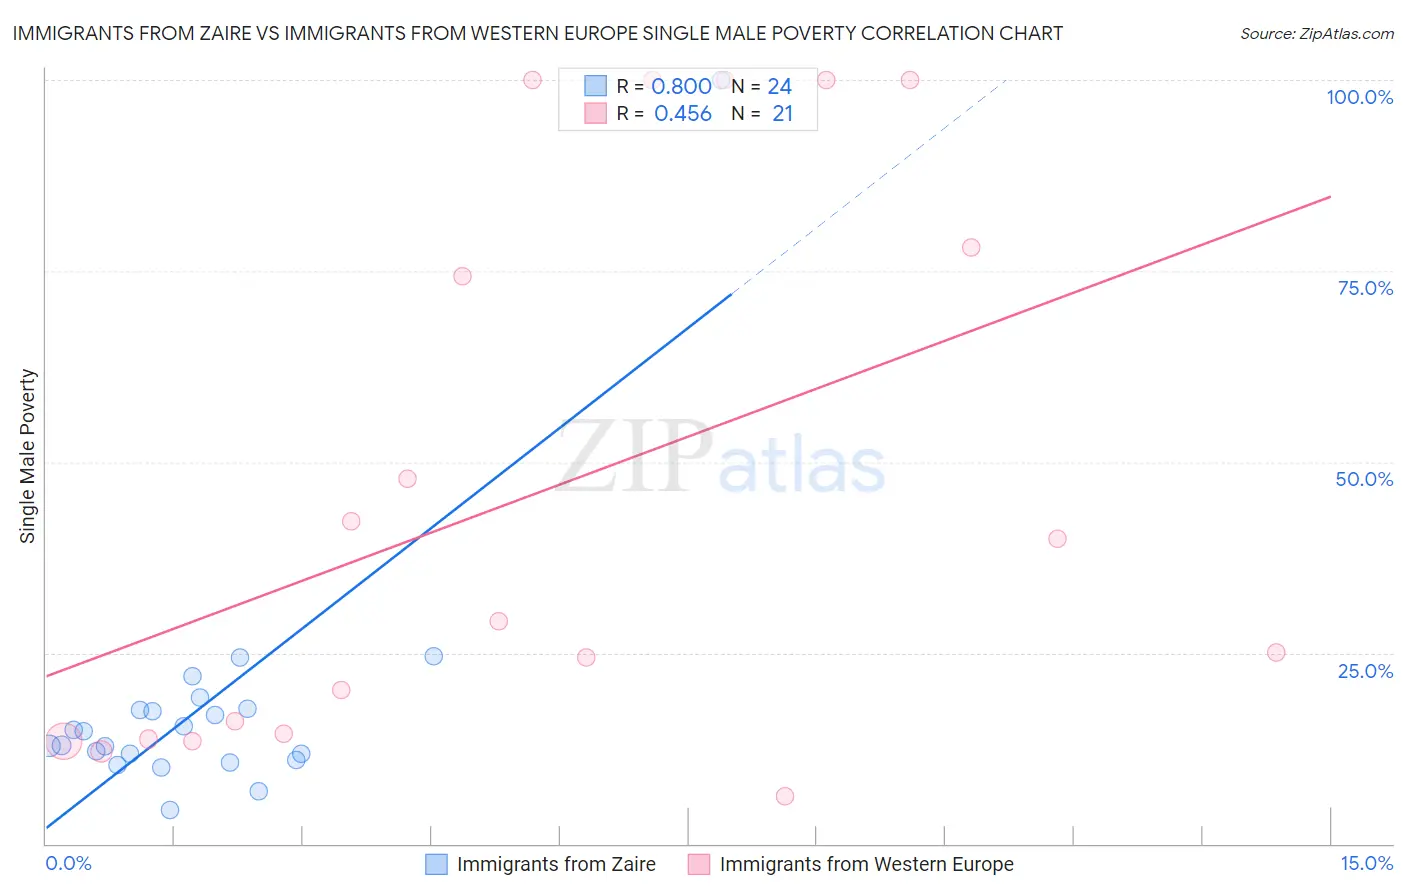
Immigrants from Zaire vs Immigrants from Western Europe Single Male Poverty Correlation Chart
The statistical analysis conducted on geographies consisting of 103,503,403 people shows a strong positive correlation between the proportion of Immigrants from Zaire and poverty level among single males in the United States with a correlation coefficient (R) of 0.800 and weighted average of 13.6%. Similarly, the statistical analysis conducted on geographies consisting of 423,836,608 people shows a moderate positive correlation between the proportion of Immigrants from Western Europe and poverty level among single males in the United States with a correlation coefficient (R) of 0.456 and weighted average of 13.2%, a difference of 3.2%.
Single Male Poverty Correlation Summary
| Measurement | Immigrants from Zaire | Immigrants from Western Europe |
| Minimum | 4.4% | 6.2% |
| Maximum | 100.0% | 100.0% |
| Range | 95.6% | 93.8% |
| Mean | 18.0% | 46.2% |
| Median | 13.8% | 29.2% |
| Interquartile 25% (IQ1) | 11.3% | 14.1% |
| Interquartile 75% (IQ3) | 17.6% | 89.0% |
| Interquartile Range (IQR) | 6.2% | 74.9% |
| Standard Deviation (Sample) | 18.2% | 36.1% |
| Standard Deviation (Population) | 17.8% | 35.3% |
Similar Demographics by Single Male Poverty
Demographics Similar to Immigrants from Zaire by Single Male Poverty
In terms of single male poverty, the demographic groups most similar to Immigrants from Zaire are Finnish (13.6%, a difference of 0.050%), Immigrants from Somalia (13.6%, a difference of 0.11%), Spanish (13.6%, a difference of 0.13%), German Russian (13.6%, a difference of 0.19%), and Czech (13.5%, a difference of 0.37%).
| Demographics | Rating | Rank | Single Male Poverty |
| Immigrants | Senegal | 1.7 /100 | #244 | Tragic 13.5% |
| Immigrants | Latin America | 1.3 /100 | #245 | Tragic 13.5% |
| Immigrants | Micronesia | 1.2 /100 | #246 | Tragic 13.5% |
| Belgians | 1.2 /100 | #247 | Tragic 13.5% |
| Czechs | 1.2 /100 | #248 | Tragic 13.5% |
| Spanish | 1.0 /100 | #249 | Tragic 13.6% |
| Immigrants | Somalia | 1.0 /100 | #250 | Tragic 13.6% |
| Immigrants | Zaire | 0.9 /100 | #251 | Tragic 13.6% |
| Finns | 0.9 /100 | #252 | Tragic 13.6% |
| German Russians | 0.8 /100 | #253 | Tragic 13.6% |
| Sub-Saharan Africans | 0.5 /100 | #254 | Tragic 13.7% |
| Spaniards | 0.4 /100 | #255 | Tragic 13.7% |
| Immigrants | Belize | 0.4 /100 | #256 | Tragic 13.7% |
| Immigrants | Central America | 0.3 /100 | #257 | Tragic 13.8% |
| Immigrants | Guatemala | 0.3 /100 | #258 | Tragic 13.8% |
Demographics Similar to Immigrants from Western Europe by Single Male Poverty
In terms of single male poverty, the demographic groups most similar to Immigrants from Western Europe are New Zealander (13.2%, a difference of 0.090%), Central American (13.2%, a difference of 0.11%), Immigrants from the Azores (13.2%, a difference of 0.11%), Somali (13.2%, a difference of 0.15%), and Immigrants from Denmark (13.2%, a difference of 0.20%).
| Demographics | Rating | Rank | Single Male Poverty |
| Japanese | 14.8 /100 | #215 | Poor 13.1% |
| Austrians | 13.9 /100 | #216 | Poor 13.1% |
| Bermudans | 13.0 /100 | #217 | Poor 13.1% |
| Scandinavians | 12.9 /100 | #218 | Poor 13.1% |
| Immigrants | Burma/Myanmar | 12.6 /100 | #219 | Poor 13.1% |
| Central Americans | 10.9 /100 | #220 | Poor 13.2% |
| New Zealanders | 10.7 /100 | #221 | Poor 13.2% |
| Immigrants | Western Europe | 10.0 /100 | #222 | Poor 13.2% |
| Immigrants | Azores | 9.3 /100 | #223 | Tragic 13.2% |
| Somalis | 9.1 /100 | #224 | Tragic 13.2% |
| Immigrants | Denmark | 8.7 /100 | #225 | Tragic 13.2% |
| Jamaicans | 7.7 /100 | #226 | Tragic 13.2% |
| Haitians | 7.0 /100 | #227 | Tragic 13.2% |
| Lebanese | 6.6 /100 | #228 | Tragic 13.2% |
| Europeans | 6.2 /100 | #229 | Tragic 13.3% |