Immigrants from Zaire vs Czechoslovakian Single Male Poverty
COMPARE
Immigrants from Zaire
Czechoslovakian
Single Male Poverty
Single Male Poverty Comparison
Immigrants from Zaire
Czechoslovakians
13.6%
SINGLE MALE POVERTY
0.9/ 100
METRIC RATING
251st/ 347
METRIC RANK
13.4%
SINGLE MALE POVERTY
3.0/ 100
METRIC RATING
239th/ 347
METRIC RANK
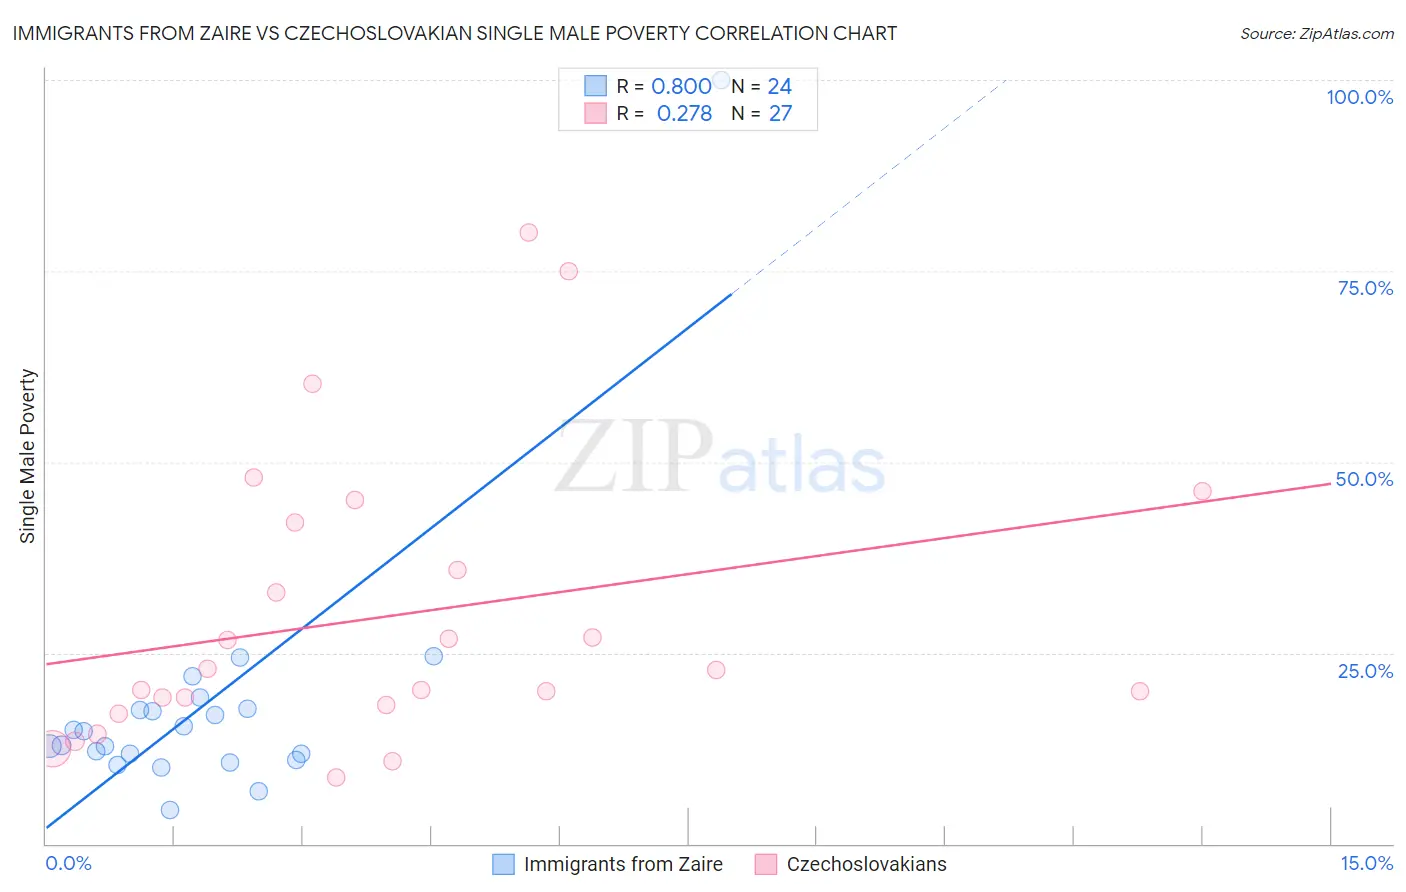
Immigrants from Zaire vs Czechoslovakian Single Male Poverty Correlation Chart
The statistical analysis conducted on geographies consisting of 103,503,403 people shows a strong positive correlation between the proportion of Immigrants from Zaire and poverty level among single males in the United States with a correlation coefficient (R) of 0.800 and weighted average of 13.6%. Similarly, the statistical analysis conducted on geographies consisting of 321,828,483 people shows a weak positive correlation between the proportion of Czechoslovakians and poverty level among single males in the United States with a correlation coefficient (R) of 0.278 and weighted average of 13.4%, a difference of 1.5%.
Single Male Poverty Correlation Summary
| Measurement | Immigrants from Zaire | Czechoslovakian |
| Minimum | 4.4% | 8.6% |
| Maximum | 100.0% | 80.0% |
| Range | 95.6% | 71.4% |
| Mean | 18.0% | 29.8% |
| Median | 13.8% | 22.7% |
| Interquartile 25% (IQ1) | 11.3% | 18.2% |
| Interquartile 75% (IQ3) | 17.6% | 42.1% |
| Interquartile Range (IQR) | 6.2% | 23.9% |
| Standard Deviation (Sample) | 18.2% | 18.8% |
| Standard Deviation (Population) | 17.8% | 18.4% |
Demographics Similar to Immigrants from Zaire and Czechoslovakians by Single Male Poverty
In terms of single male poverty, the demographic groups most similar to Immigrants from Zaire are Finnish (13.6%, a difference of 0.050%), Immigrants from Somalia (13.6%, a difference of 0.11%), Spanish (13.6%, a difference of 0.13%), German Russian (13.6%, a difference of 0.19%), and Czech (13.5%, a difference of 0.37%). Similarly, the demographic groups most similar to Czechoslovakians are Immigrants from Ghana (13.4%, a difference of 0.080%), British West Indian (13.4%, a difference of 0.18%), Luxembourger (13.4%, a difference of 0.24%), Bangladeshi (13.3%, a difference of 0.29%), and Belizean (13.4%, a difference of 0.30%).
| Demographics | Rating | Rank | Single Male Poverty |
| Bangladeshis | 3.7 /100 | #235 | Tragic 13.3% |
| Luxembourgers | 3.6 /100 | #236 | Tragic 13.4% |
| British West Indians | 3.4 /100 | #237 | Tragic 13.4% |
| Immigrants | Ghana | 3.2 /100 | #238 | Tragic 13.4% |
| Czechoslovakians | 3.0 /100 | #239 | Tragic 13.4% |
| Belizeans | 2.3 /100 | #240 | Tragic 13.4% |
| Immigrants | Germany | 2.1 /100 | #241 | Tragic 13.4% |
| Carpatho Rusyns | 2.1 /100 | #242 | Tragic 13.4% |
| Barbadians | 2.1 /100 | #243 | Tragic 13.4% |
| Immigrants | Senegal | 1.7 /100 | #244 | Tragic 13.5% |
| Immigrants | Latin America | 1.3 /100 | #245 | Tragic 13.5% |
| Immigrants | Micronesia | 1.2 /100 | #246 | Tragic 13.5% |
| Belgians | 1.2 /100 | #247 | Tragic 13.5% |
| Czechs | 1.2 /100 | #248 | Tragic 13.5% |
| Spanish | 1.0 /100 | #249 | Tragic 13.6% |
| Immigrants | Somalia | 1.0 /100 | #250 | Tragic 13.6% |
| Immigrants | Zaire | 0.9 /100 | #251 | Tragic 13.6% |
| Finns | 0.9 /100 | #252 | Tragic 13.6% |
| German Russians | 0.8 /100 | #253 | Tragic 13.6% |
| Sub-Saharan Africans | 0.5 /100 | #254 | Tragic 13.7% |
| Spaniards | 0.4 /100 | #255 | Tragic 13.7% |