Immigrants from Zaire vs Colombian Householder Income Ages 45 - 64 years
COMPARE
Immigrants from Zaire
Colombian
Householder Income Ages 45 - 64 years
Householder Income Ages 45 - 64 years Comparison
Immigrants from Zaire
Colombians
$85,207
HOUSEHOLDER INCOME AGES 45 - 64 YEARS
0.1/ 100
METRIC RATING
296th/ 347
METRIC RANK
$99,772
HOUSEHOLDER INCOME AGES 45 - 64 YEARS
43.2/ 100
METRIC RATING
185th/ 347
METRIC RANK
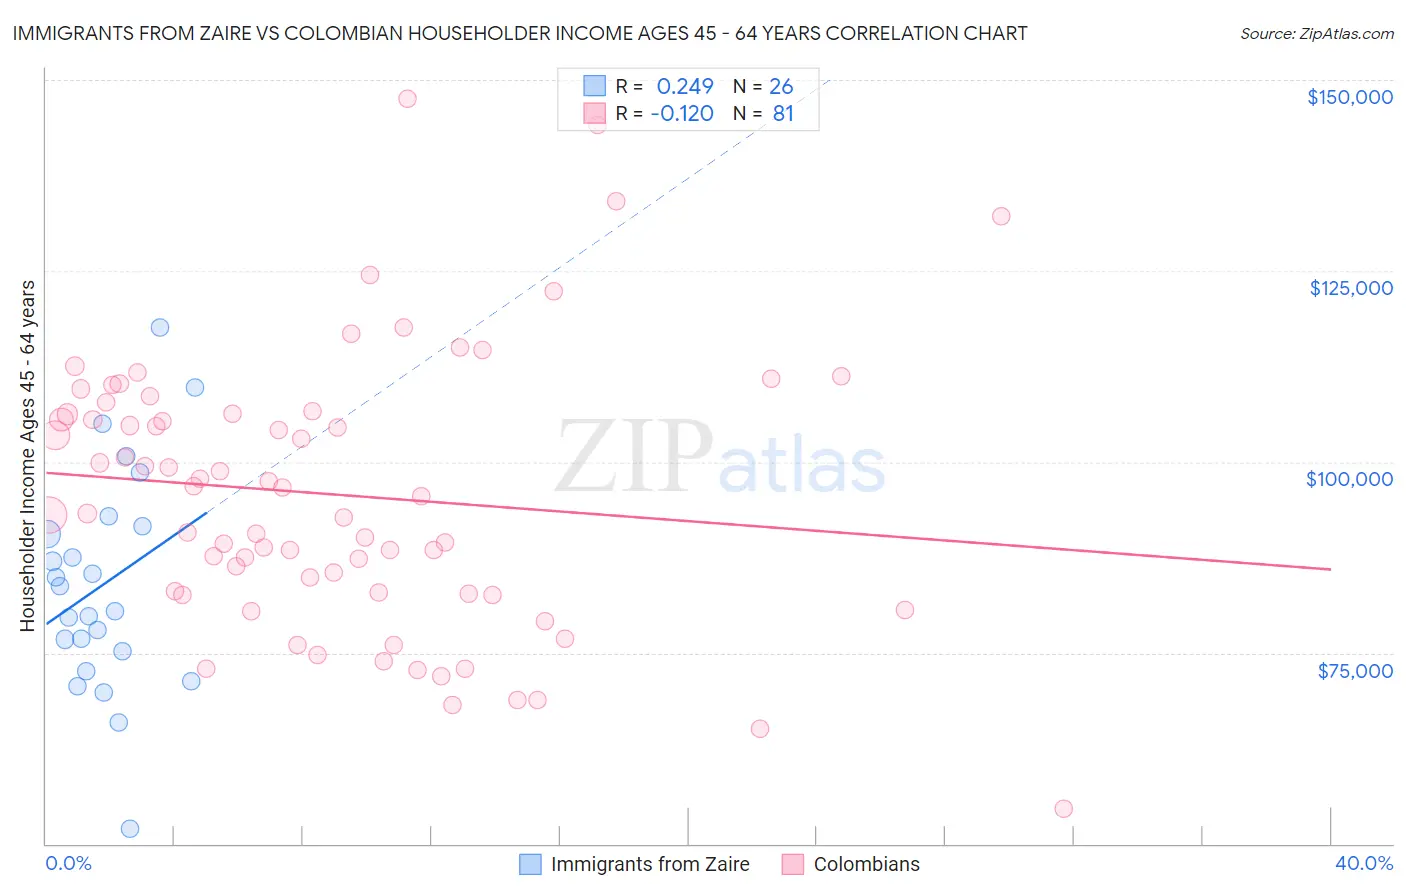
Immigrants from Zaire vs Colombian Householder Income Ages 45 - 64 years Correlation Chart
The statistical analysis conducted on geographies consisting of 107,222,169 people shows a weak positive correlation between the proportion of Immigrants from Zaire and household income with householder between the ages 45 and 64 in the United States with a correlation coefficient (R) of 0.249 and weighted average of $85,207. Similarly, the statistical analysis conducted on geographies consisting of 418,806,798 people shows a poor negative correlation between the proportion of Colombians and household income with householder between the ages 45 and 64 in the United States with a correlation coefficient (R) of -0.120 and weighted average of $99,772, a difference of 17.1%.
Householder Income Ages 45 - 64 years Correlation Summary
| Measurement | Immigrants from Zaire | Colombian |
| Minimum | $51,937 | $54,659 |
| Maximum | $117,531 | $147,591 |
| Range | $65,594 | $92,932 |
| Mean | $84,004 | $95,720 |
| Median | $82,074 | $95,478 |
| Interquartile 25% (IQ1) | $75,184 | $82,814 |
| Interquartile 75% (IQ3) | $91,518 | $106,476 |
| Interquartile Range (IQR) | $16,334 | $23,662 |
| Standard Deviation (Sample) | $14,467 | $17,882 |
| Standard Deviation (Population) | $14,186 | $17,771 |
Similar Demographics by Householder Income Ages 45 - 64 years
Demographics Similar to Immigrants from Zaire by Householder Income Ages 45 - 64 years
In terms of householder income ages 45 - 64 years, the demographic groups most similar to Immigrants from Zaire are Fijian ($85,187, a difference of 0.020%), African ($84,925, a difference of 0.33%), Immigrants from Mexico ($84,910, a difference of 0.35%), Indonesian ($84,890, a difference of 0.37%), and Immigrants from Grenada ($85,552, a difference of 0.40%).
| Demographics | Rating | Rank | Householder Income Ages 45 - 64 years |
| Cubans | 0.1 /100 | #289 | Tragic $86,301 |
| Cherokee | 0.1 /100 | #290 | Tragic $86,125 |
| Hispanics or Latinos | 0.1 /100 | #291 | Tragic $86,006 |
| Immigrants | Central America | 0.1 /100 | #292 | Tragic $85,965 |
| Comanche | 0.1 /100 | #293 | Tragic $85,787 |
| British West Indians | 0.1 /100 | #294 | Tragic $85,571 |
| Immigrants | Grenada | 0.1 /100 | #295 | Tragic $85,552 |
| Immigrants | Zaire | 0.1 /100 | #296 | Tragic $85,207 |
| Fijians | 0.1 /100 | #297 | Tragic $85,187 |
| Africans | 0.0 /100 | #298 | Tragic $84,925 |
| Immigrants | Mexico | 0.0 /100 | #299 | Tragic $84,910 |
| Indonesians | 0.0 /100 | #300 | Tragic $84,890 |
| Potawatomi | 0.0 /100 | #301 | Tragic $84,613 |
| Haitians | 0.0 /100 | #302 | Tragic $84,384 |
| Hondurans | 0.0 /100 | #303 | Tragic $84,079 |
Demographics Similar to Colombians by Householder Income Ages 45 - 64 years
In terms of householder income ages 45 - 64 years, the demographic groups most similar to Colombians are French ($99,824, a difference of 0.050%), Spaniard ($99,889, a difference of 0.12%), Dutch ($99,650, a difference of 0.12%), Finnish ($99,904, a difference of 0.13%), and Immigrants ($99,943, a difference of 0.17%).
| Demographics | Rating | Rank | Householder Income Ages 45 - 64 years |
| Immigrants | Cameroon | 47.0 /100 | #178 | Average $100,084 |
| Belgians | 46.7 /100 | #179 | Average $100,060 |
| Aleuts | 46.6 /100 | #180 | Average $100,052 |
| Immigrants | Immigrants | 45.3 /100 | #181 | Average $99,943 |
| Finns | 44.8 /100 | #182 | Average $99,904 |
| Spaniards | 44.6 /100 | #183 | Average $99,889 |
| French | 43.8 /100 | #184 | Average $99,824 |
| Colombians | 43.2 /100 | #185 | Average $99,772 |
| Dutch | 41.7 /100 | #186 | Average $99,650 |
| Iraqis | 38.5 /100 | #187 | Fair $99,387 |
| Immigrants | Portugal | 36.3 /100 | #188 | Fair $99,203 |
| Immigrants | South America | 35.4 /100 | #189 | Fair $99,126 |
| French Canadians | 35.1 /100 | #190 | Fair $99,093 |
| Kenyans | 33.7 /100 | #191 | Fair $98,970 |
| Celtics | 32.9 /100 | #192 | Fair $98,896 |