Immigrants from Western Europe vs Samoan In Labor Force | Age > 16
COMPARE
Immigrants from Western Europe
Samoan
In Labor Force | Age > 16
In Labor Force | Age > 16 Comparison
Immigrants from Western Europe
Samoans
64.2%
IN LABOR FORCE | AGE > 16
0.7/ 100
METRIC RATING
259th/ 347
METRIC RANK
65.5%
IN LABOR FORCE | AGE > 16
90.5/ 100
METRIC RATING
141st/ 347
METRIC RANK
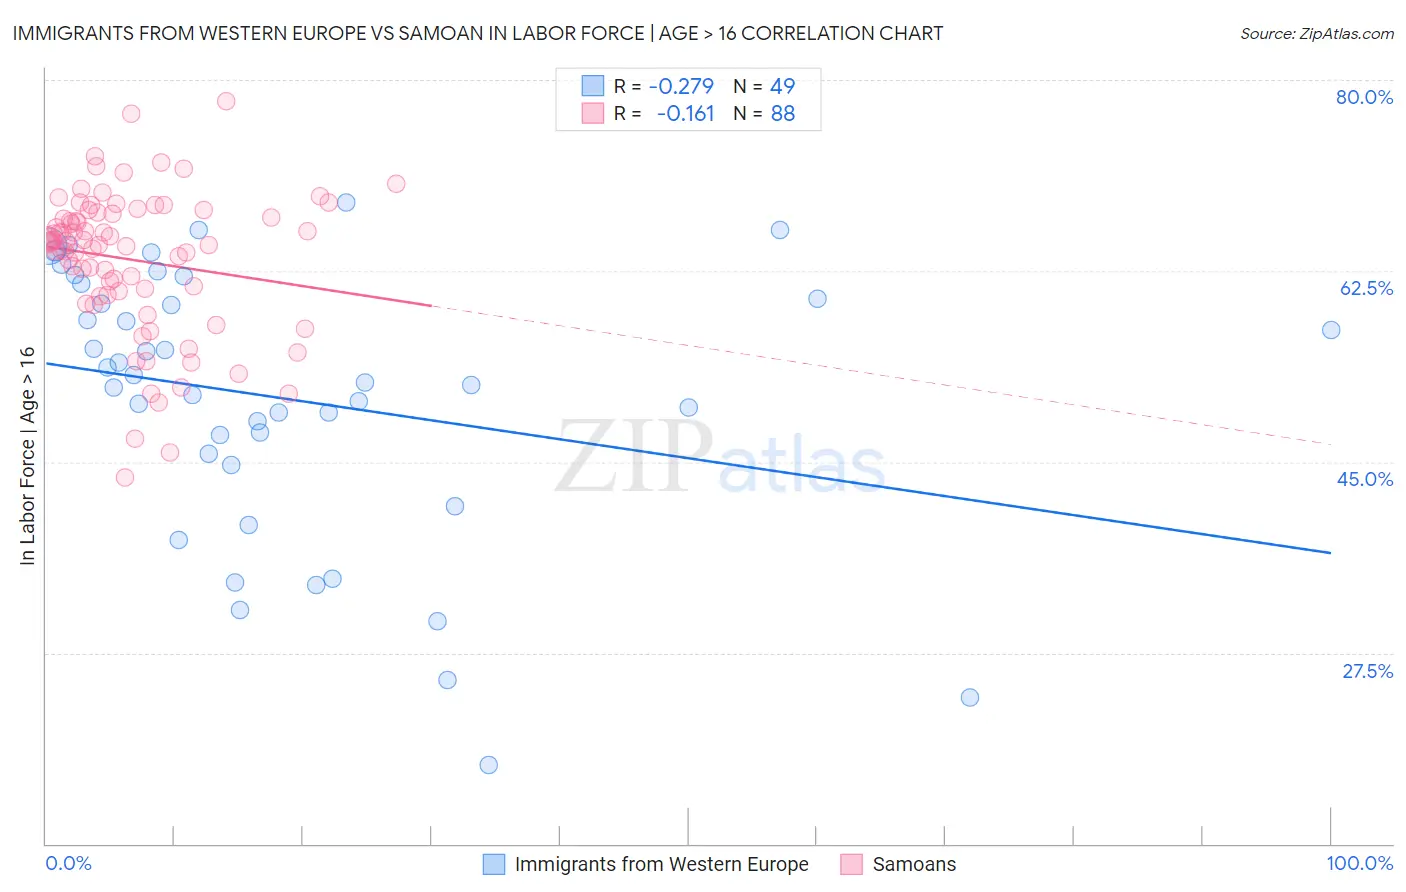
Immigrants from Western Europe vs Samoan In Labor Force | Age > 16 Correlation Chart
The statistical analysis conducted on geographies consisting of 494,084,612 people shows a weak negative correlation between the proportion of Immigrants from Western Europe and labor force participation rate among population ages 16 and over in the United States with a correlation coefficient (R) of -0.279 and weighted average of 64.2%. Similarly, the statistical analysis conducted on geographies consisting of 225,191,337 people shows a poor negative correlation between the proportion of Samoans and labor force participation rate among population ages 16 and over in the United States with a correlation coefficient (R) of -0.161 and weighted average of 65.5%, a difference of 2.0%.
In Labor Force | Age > 16 Correlation Summary
| Measurement | Immigrants from Western Europe | Samoan |
| Minimum | 17.2% | 43.6% |
| Maximum | 68.8% | 78.1% |
| Range | 51.6% | 34.5% |
| Mean | 50.8% | 63.5% |
| Median | 52.2% | 65.1% |
| Interquartile 25% (IQ1) | 45.2% | 60.5% |
| Interquartile 75% (IQ3) | 60.6% | 67.8% |
| Interquartile Range (IQR) | 15.4% | 7.3% |
| Standard Deviation (Sample) | 12.4% | 6.6% |
| Standard Deviation (Population) | 12.2% | 6.5% |
Similar Demographics by In Labor Force | Age > 16
Demographics Similar to Immigrants from Western Europe by In Labor Force | Age > 16
In terms of in labor force | age > 16, the demographic groups most similar to Immigrants from Western Europe are Marshallese (64.2%, a difference of 0.010%), Basque (64.2%, a difference of 0.010%), Finnish (64.2%, a difference of 0.020%), Immigrants from Scotland (64.2%, a difference of 0.030%), and Bahamian (64.2%, a difference of 0.040%).
| Demographics | Rating | Rank | In Labor Force | Age > 16 |
| Immigrants | Dominican Republic | 1.5 /100 | #252 | Tragic 64.4% |
| Czechoslovakians | 1.4 /100 | #253 | Tragic 64.3% |
| Immigrants | Uzbekistan | 1.4 /100 | #254 | Tragic 64.3% |
| Hispanics or Latinos | 1.1 /100 | #255 | Tragic 64.3% |
| Immigrants | Mexico | 1.0 /100 | #256 | Tragic 64.3% |
| Inupiat | 0.8 /100 | #257 | Tragic 64.3% |
| Immigrants | Scotland | 0.8 /100 | #258 | Tragic 64.2% |
| Immigrants | Western Europe | 0.7 /100 | #259 | Tragic 64.2% |
| Marshallese | 0.7 /100 | #260 | Tragic 64.2% |
| Basques | 0.7 /100 | #261 | Tragic 64.2% |
| Finns | 0.7 /100 | #262 | Tragic 64.2% |
| Bahamians | 0.6 /100 | #263 | Tragic 64.2% |
| Dutch | 0.6 /100 | #264 | Tragic 64.2% |
| Cubans | 0.5 /100 | #265 | Tragic 64.2% |
| Immigrants | England | 0.5 /100 | #266 | Tragic 64.2% |
Demographics Similar to Samoans by In Labor Force | Age > 16
In terms of in labor force | age > 16, the demographic groups most similar to Samoans are Immigrants from Taiwan (65.5%, a difference of 0.010%), Immigrants from Costa Rica (65.5%, a difference of 0.010%), Indian (Asian) (65.5%, a difference of 0.030%), Latvian (65.5%, a difference of 0.030%), and Immigrants from West Indies (65.6%, a difference of 0.050%).
| Demographics | Rating | Rank | In Labor Force | Age > 16 |
| Costa Ricans | 93.2 /100 | #134 | Exceptional 65.6% |
| Guatemalans | 92.5 /100 | #135 | Exceptional 65.6% |
| Immigrants | Argentina | 92.4 /100 | #136 | Exceptional 65.6% |
| Guamanians/Chamorros | 92.4 /100 | #137 | Exceptional 65.6% |
| Immigrants | West Indies | 92.0 /100 | #138 | Exceptional 65.6% |
| Immigrants | Taiwan | 90.8 /100 | #139 | Exceptional 65.5% |
| Immigrants | Costa Rica | 90.8 /100 | #140 | Exceptional 65.5% |
| Samoans | 90.5 /100 | #141 | Exceptional 65.5% |
| Indians (Asian) | 89.5 /100 | #142 | Excellent 65.5% |
| Latvians | 89.4 /100 | #143 | Excellent 65.5% |
| Immigrants | Romania | 88.6 /100 | #144 | Excellent 65.5% |
| Tlingit-Haida | 88.3 /100 | #145 | Excellent 65.5% |
| Cypriots | 88.2 /100 | #146 | Excellent 65.5% |
| Immigrants | Oceania | 87.5 /100 | #147 | Excellent 65.5% |
| Bhutanese | 86.3 /100 | #148 | Excellent 65.5% |